
Figures & data
Table 1 Primer Sequences Used for qPCR
Table 2 Ag Uptake in Zebrafish Embryos with or Without AgNP Treatment at Different Concentrations
Figure 1 The effect of AgNP treatment on eye development in zebrafish. (A) The morphology of zebrafish eyes after 48 and 72 h of AgNP treatment, Scale bar, 1 mm. (B and C) Quantification of the diameters of whole eyes of zebrafish after 48 and 72 h of AgNP treatment (n = 30 for each group). Data are shown as the means ± SEM. *P < 0.05, **P < 0.01, ***P < 0.001. Red boxes, eye regions.
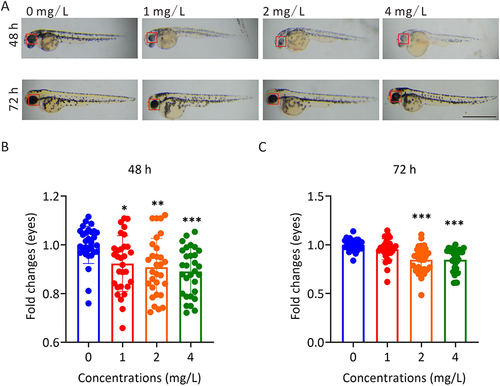
Figure 2 The effect of AgNP treatment on neurodevelopment in zebrafish. (A) Neuronal morphology of zebrafish embryos after 72 h of AgNP treatment. Scale bar, 200 μm. (B) Quantification of the fluorescence intensity of motor neurons in zebrafish after 72 h of AgNP treatment (n = 30 for each group). (C) Quantification of the number of caudal side neurons in zebrafish after 72 h of AgNP treatment (n = 25 for each group). (D) Quantification of the axon lengths of motor neurons in AgNP-treated zebrafish embryos after 72 h (n = 30 for each group). (E) Moving track graphs of zebrafish larvae after 96 h of AgNP treatment at various concentrations. (F) The behavioral abilities of zebrafish larvae treated with AgNP for 96 h (n = 24 for each group). Data are shown as the means ± SEM. *P < 0.05 and ***P < 0.001. Red arrowheads represent spinal cord motor neurons, and yellow arrowheads or asterisks represent axons.
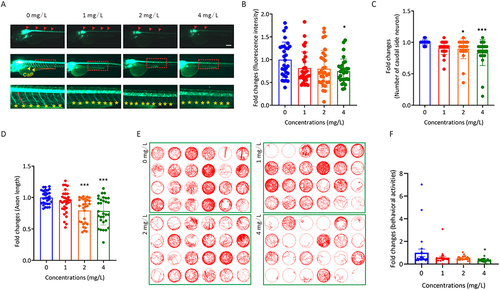
Figure 3 The toxic effects of AgNP exposure on vascular development in zebrafish embryos and HUVECs. (A) Representative images of vasculatures of Tg(flk:eGFP) zebrafish treated with AgNP for 72 h. Scale bars, 200 μm. (B) Number of abnormal ISV in zebrafish embryos after 72 h of AgNP treatment at various concentrations (n = 9 for each group). (C) The areas of the SIVP basket in AgNP-treated zebrafish embryos after 72 h at various concentrations (n = 15 for each group). (D) The fluorescence intensities of blood vessels in the brains of zebrafish embryos after 72 h of AgNP treatment at various concentrations (n = 10 for each group). (E and F) The representative images and quantification of scratch migration in HUVECs with and without AgNP treatment at various concentrations (0, 1, 2, and 4 mg/L) and time points (0 and 18 h; n = 4 replicates). (G and H) Representative images and quantification of tube formation in AgNP-treated HUVECs at various concentrations (0 and 4 mg/L; n = 3 replicates) after 72 h. Data are shown as the means ± SEM. *P < 0.05, **P < 0.01, and ***P < 0.001. In the trunk panel are red arrowheads, DA; white arrowheads, DLAV; red arrows, PCV; asterisks, ISV. In the intestine panel, yellow broken circle, SIVP. In the head panel are yellow arrowheads, DLV; red arrowheads, PCeV; red lines, PHBC; red arrows, CtA; red arrowhead, PCeV.
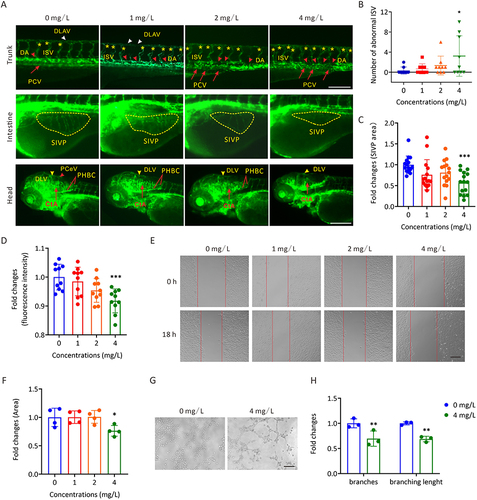
Figure 4 The identification of downstream pathways in AgNP-induced developmental disruption in zebrafish embryos. (A and B) The KEGG pathway enrichment analysis of top 3000 DEGs in zebrafish embryos after 72 h of AgNP exposure at various concentrations. (C and D) Heat map analysis of the DEGs enriched in neuroactive ligand-receptor interaction and Vegf signaling pathways in zebrafish embryos after 72 h of AgNP exposure at various concentrations. (E and F) The mRNA level of neuroactive ligand-receptor interaction and Vegf pathway-related genes in zebrafish embryos after AgNP exposure at various concentrations (n = 3 replicates). Data are shown as the means ± SEM. *P < 0.05, **P < 0.01, and ***P < 0.001.
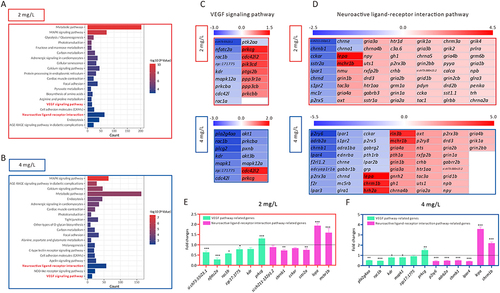
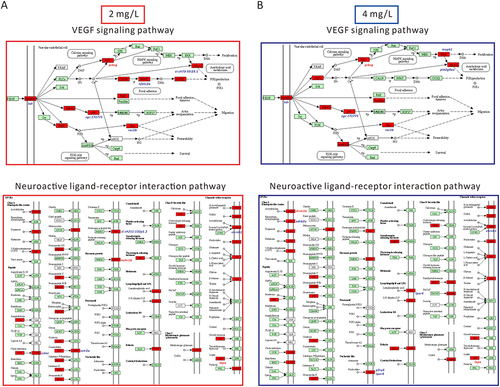
Figure 5 Schematic representation of the DEGs of neuroactive ligand-receptor interaction and Vegf signaling pathway in zebrafish after 72 h of AgNP exposure at various concentrations. (A) DEGs diagram of neuroactive ligand-receptor interactions and Vegf signaling pathways after exposure to 2 mg/L AgNP. (B) DEGs diagram of neuroactive ligand-receptor interactions and Vegf signaling pathways after exposure to 4 mg/L AgNP. The red shading represents the DEGs in these two signaling pathways.
Data Sharing Statement
The RNA-seq data have been deposited in the Sequence Read Archive of the National Center for Biotechnology Information under accession number PRJNA793391.