Figures & data
Scheme 1 Schematic (A) and intracellular performance (B) of mPEG-SS-PGG-SS-IR780/PTXL MCs.
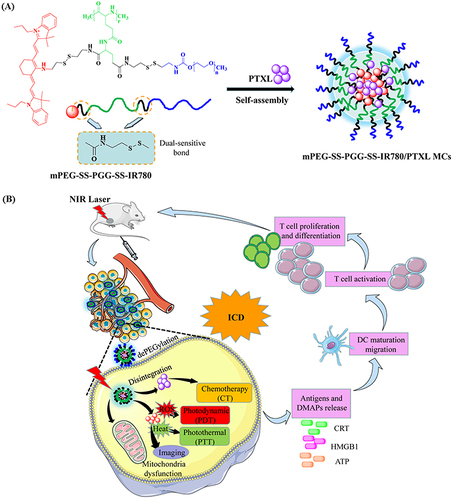
Figure 1 Synthesis routes of mPEG-SS-PGG-SS-IR780 conjugates (via steps (A–D)).
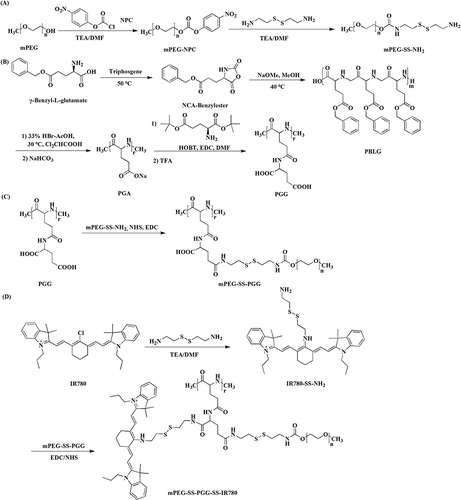
Figure 2 (A) 1H-NMR spectra of mPEG-SS-NH2 in CDCl3, PGG in D2O, and mPEG-SS-PGG-SS-IR780 in CDCl3. (B) 1H-NMR spectra of mPEG-SS-PGG-7 in D2O (hydrolysis for 7 h). (The red text represented the characteristic hydrogen atoms of mPEG-SS-PGG-7 as well as their chemical shifts.) (C) Diameter and size distribution of mPEG-SS-PGG-SS-IR780-1/PTXL MCs (hydrolysis for 1 h), mPEG-SS-PGG-SS-IR780-3/PTXL MCs (hydrolysis for 3 h), mPEG-SS-PGG-SS-IR780-5/PTXL MCs (hydrolysis for 5 h), mPEG-SS-PGG-SS-IR780-7/PTXL MCs (hydrolysis for 7 h), and mPEG-PGG-IR780-7/PTXL MCs (hydrolysis for 7 h) by DLS and TEM. Scale bar: 0.5 μm.
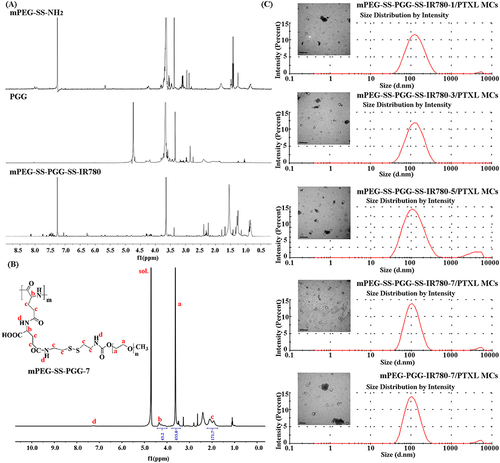
Table 1 Characterization of Micelles (Mean ± SD, n = 3)
Figure 3 (A) CMC of mPEG-SS-PGG-SS-IR780/PTXL MCs. (B) UV-vis spectra of IR780 iodide, PTXL, and mPEG-SS-PGG-SS-IR780/PTXL MC solutions. (C) Controlled release profiles of mPEG-SS-PGG-SS-IR780/PTXL MCs with or without laser irradiation (red arrows indicated laser irradiation). Data were means ± SD (n = 3). (D) In-vitro PTXL release profiles from the mPEG-SS-PGG-SS-IR780/PTXL MCs at (a) 10 mM PBS with 20 μM GSH (pH 7.4), (b) 10 mM PBS with 20 mM GSH (pH 7.4), (c) 10 mM PBS with 20 μM GSH (pH 5.0), (d) 10 mM PBS with 20 mM GSH (pH 5.0), and (e) PTXL in 10 mM PBS with 20 mM GSH (pH 5.0). Data were means ± SD (n = 3). (E) UV-vis spectra of free IR780 and mPEG-SS-PGG-SS-IR780/PTXL MCs in the dark or exposed to light at 0, 4, 8, and 12 h. (F) Singlet oxygen generation abilities of IR780 and mPEG-SS-PGG-SS-IR780/PTXL MCs under NIR laser irradiation (1 W/cm2) for different period times. (G) Thermal images and temperature elevation profiles of PBS (a), IR780 (b) and mPEG-SS-PGG-SS-IR780/PTXL MCs (c) under NIR laser irradiation (1 W/cm2, 5 min). Data were means ± SD (n = 3).
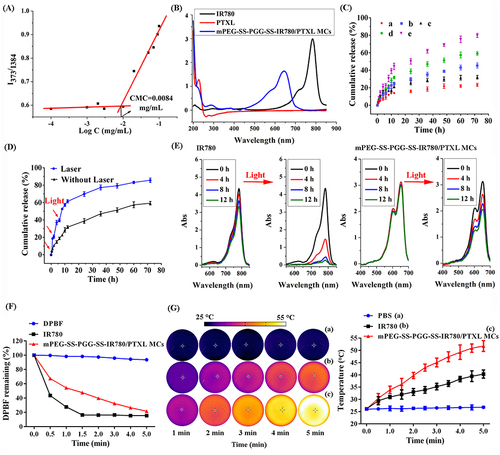
Table 2 Size and Distributions of mPEG-SS-PGG-SS-IR780/PTXL MCs Incubated at Different Conditions
Figure 4 Hemolysis ratio (A) and photos (B) of red blood cells after being cultured with PTXL and mPEG-SS-PGG-SS-IR780/PTXL MCs at various concentrations (n = 5). (C) CLSM images of A549 and NCL-H1975 cells incubated with different formulations. Scale bar: 20 μm. (D) Cell uptake of control, mPEG-SS-PGG-SS-IR780/PTXL MCs (a), mPEG-PGG-IR780/PTXL MCs + L (b), and mPEG-SS-PGG-SS-IR780/PTXL MCs + L (c) analyzed by FCM. Mean fluorescence intensities showing the IR780 intensity inside A549 cells incubated with mPEG-SS-PGG-SS-IR780/PTXL MCs (a), mPEG-PGG-IR780/PTXL MCs + L (b), and mPEG-SS-PGG-SS-IR780/PTXL MCs + L (c). Data were means ± SD (n = 3, **P < 0.01, ***P < 0.001).
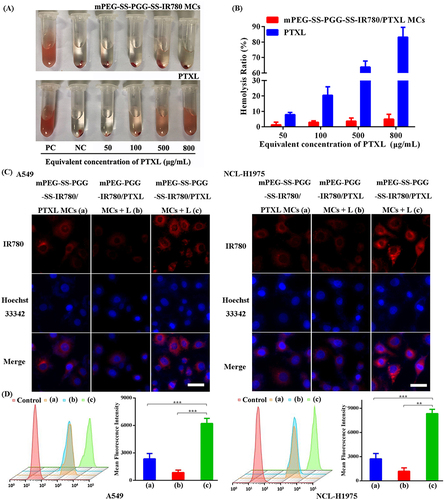
Figure 5 (A) Biocompatibility study of mPEG-SS-PGG-SS-IR780 MCs against A549 and NCL-H1975 cells for 72 h (equivalent to the equivalent concentration of PTXL, n = 6). Cytotoxicity analysis of different formulations on A549 (B) and NCL-H1975 cells (C) for 48 h through MTT assay (n = 6, **P < 0.01, ***P < 0.001). (D) Changes in A549 cell viability and morphology, as observed with an inverted microscope. Scale bar: 50 μm. (E) Flow cytometric cell apoptosis assay of Annexin V-FITC and PI double-stained A549 cells after different treatments.
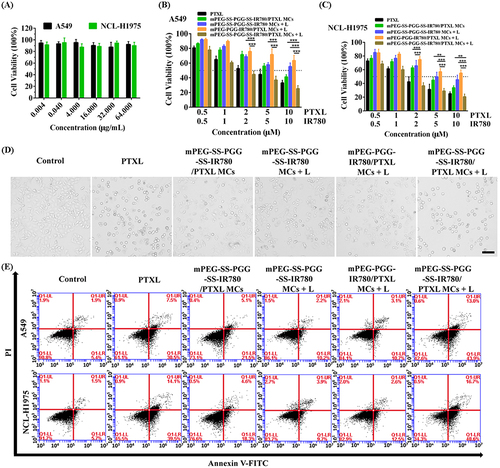
Figure 6 (A) Mitochondrial targeting ability detection. Scale bar = 20 μm. Red fluorescence represented photosensitizer, green fluorescence represented the mitochondria, and blue fluorescence represented the nucleus. The yellow channel represented colocalization of red fluorescence of the photosensitizer and green fluorescence of the mitochondria. (B) Fluorescence images of A549 cells stained with MMP probe JC-1 after various treatments. Scale bar = 50 μm. (C) Fluorescence images of A549 cells stained with ROS probe DCFH-DA after various treatments. Scale bar = 100 μm. Fluorescence intensities of A549 cells stained with ROS probe DCFH-DA measured by FCM. (D) Intracellular ATP levels of A549 cells after various treatments (n = 6, **P < 0.01, ***P < 0.001).
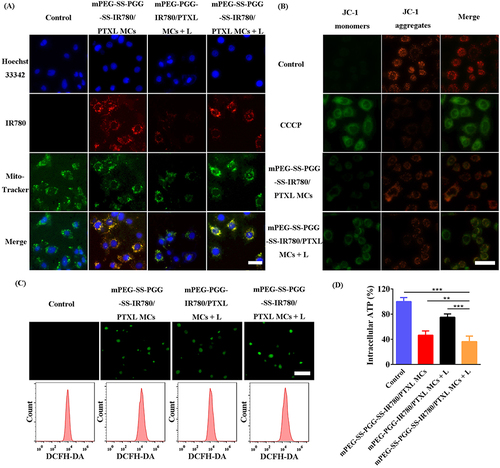
Figure 7 Immunofluorescent staining of (A) CRT (green) and (B) HMGB-1 (green), both on A549 cells. Scale bar: 20 μm. Quantitative analysis of (C) CRT and (D) HMGB-1. Data were presented as mean ± SD (n = 3, *P < 0.05, **P < 0.01, ***P < 0.001). (E) Extracellular ATP detection of A549 cells. Data were presented as mean ± SD (n = 3, *P < 0.05, **P < 0.01, ***P < 0.001). (F) Proliferation of T cells co-incubated with different treated cancer cells.
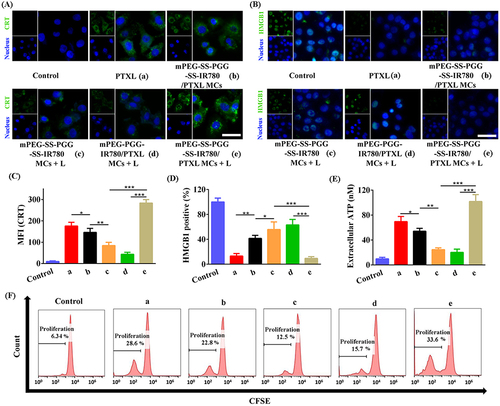
Figure 8 (A) In-vivo fluorescence images of LLC tumor-bearing mice after 4, 8, 12, 24, and 48 h of intravenous injection of IR780 and mPEG-SS-PGG-SS-IR780/PTXL MCs. (B) Ex-vivo fluorescence images of dissected major organs (heart, liver, spleen, lung, and kidney) and tumor at 48 h. (C) Thermal images of LLC tumor-bearing mice receiving intravenous injection of saline, free IR780, or mPEG-SS-PGG-SS-IR780/PTXL MCs upon laser irradiation. And changes in temperature of tumors upon laser irradiation. Data were presented as mean ± SD (n = 3).
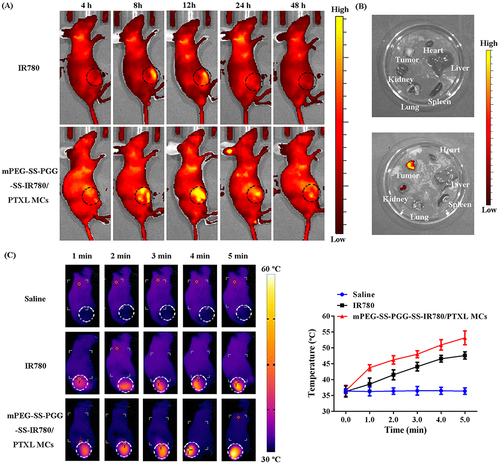
Figure 9 (A–D) Anti-tumor efficacy in LLC xenograft models: tumor growth, photographs of tumor tissues, tumor weight, and body weight profiles under different treatments. The mice were treated with various formulations by i.v. injection at a dose of 10 mg/kg PTXL (n = 5, **P < 0.01, ***P < 0.001). (E–G) Evaluation of AST, ALT, Cr, BUN, WBC, RBC, PLT, and HGB levels upon treatment with saline, PTXL, and mPEG-SS-PGG-SS-IR780/PTXL MCs + L (n = 5, *P < 0.05, **P < 0.01, ***P < 0.001). (H) Image of H&E assays in the heart, liver, spleen, lung, kidney, and tumor after treatment with various formulations over 21 days. Scale bars = 20 μm.
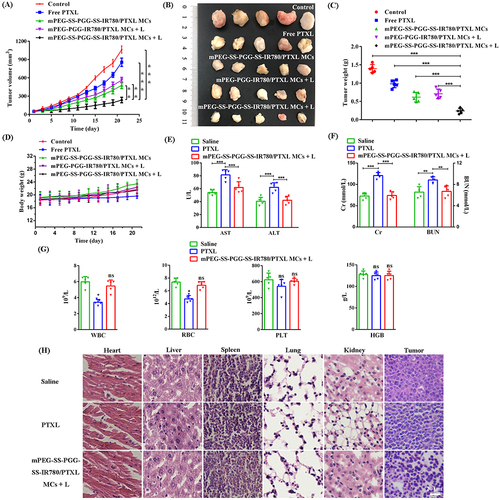
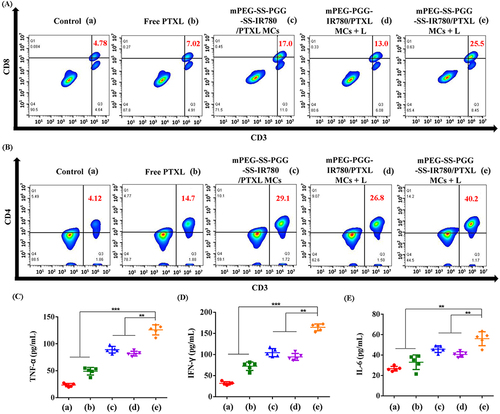
Figure 10 Representative FCM profiles of CD3+CD8+ T cells (A) and CD3+CD4+ T cells (B) in tumor. ELISA analysis of intraserous cytokine levels of TNF-α (C), IFN-γ (D), and IL-6 (E) after different treatments on day 21 (n = 5, **P < 0.01, ***P < 0.001).