Figures & data
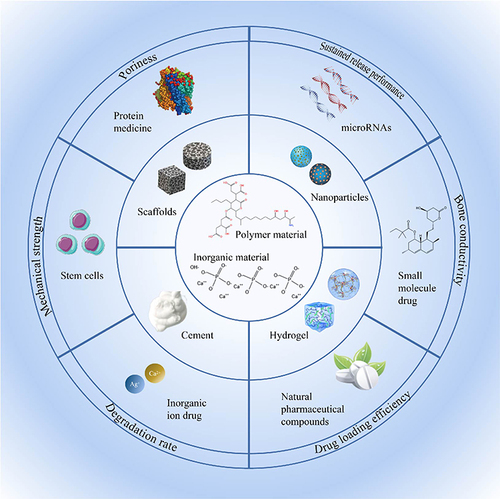
Figure 1 There are four stages of bone repair: hematoma and inflammation, cartilage callus formation, hard bone callus formation, and bone remodeling. And proinflammatory cytokines, growth factors and chemokines involved in bone regeneration.
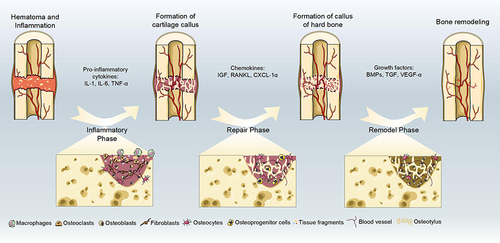
Figure 2 Application of different drug delivery systems in bone tissue engineering.
Table 1 Drug Delivery in Composite Scaffolds for Bone Tissue Engineering
Figure 3 (A) Pharmacokinetic analysis of vancomycin on β-TCP and Si-β-TCP. The halo images were suppressed by adsorbing 80% Si-β-TCP and 80% Si-CPC loaded with vancomycin. Pharmacokinetic analysis of vancomycin from CPC, 40% Si-CPC and 80% Si-CPC. (B) Release curves of cement prepared with three different concentrations of magnesium compared with unsubstituted cement. (C) The release spectra of four kinds of vancomycin mixed with HAP1 and HAP2 in different weight ratios and the time to complete the release of vancomycin in these four kinds of cement. (D) The release spectra of four kinds of ciprofloxacin mixed with HAP1 and HAP2 in different weight ratios and the time to complete the release of ciprofloxacin in these four kinds of cement.
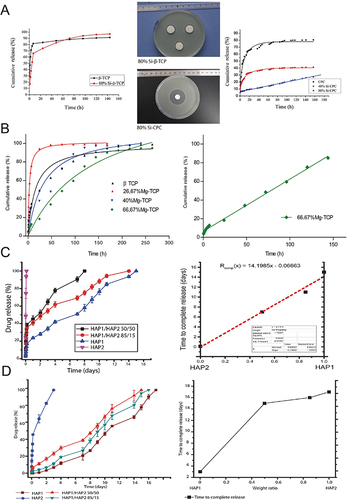
Figure 4 (A) A schematic representation of a PLLA scaffold combined with MSN-Dexa@CS. (B) The fabrication process diagram of the Dexa@MSNs-NH2/PLLA/PCL composite scaffold. (C) A schematic of the effect of Dexa@MSNs-pep on osteogenic differentiation. (D) Difference of uptake of MSNs-pep and single nano-silicon in cells. TEM images show the absorption of MSN (a1 and a2) and MSNs-pep (b1 and b2) in BMSCs, and the comparison between them in measuring the silicon quality of BMSCs by ICP-OES (c). Compared with MSNs, the uptake of MSNs-pep nanoparticles increased significantly (**p<0.01).
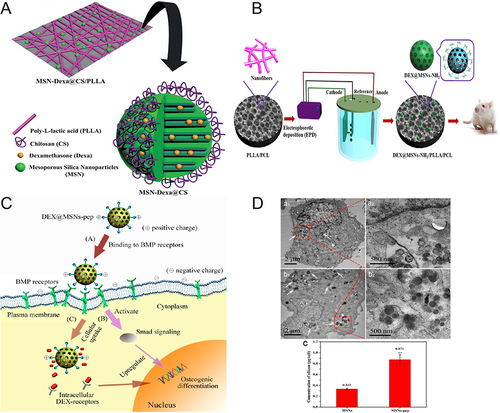
Figure 5 (A) The release profile of curcumin from HA in pH7.4 and pH5.0 showed that the release of curcumin in the first 24 hours increased by 39% and 64%, respectively, compared with that without polymer. (B) Optical microscopy images of extracellular matrix formation, angiogenesis and bone formation after 6 weeks of rat femur surgery. (C) In vitro release curve of gentamicin from each doped polymer (1%) cement. Compared with the control group (Gentamicin), the release of gentamicin mixed with cement increased significantly (***p<0.0001). (D) Elastic modulus, compressive yield and compressive strength of various polymer-doped cements with polymer content of 1% and 5%. Comparing the mechanical strength of each group, some of them have improved their mechanical properties in different degrees (*p<0.05, ***p<0.0001).
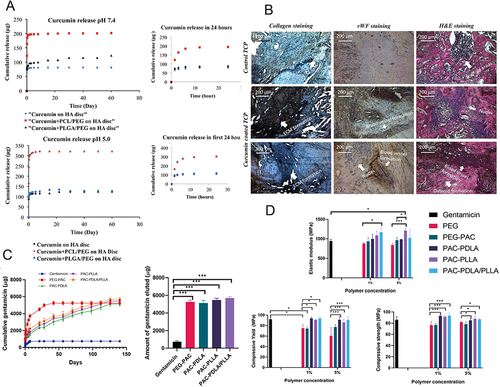
Figure 6 (A) Preparation process of hydroxyapatite/sodium alginate/chitosan (HA/SA/CS) composite microspheres. (B) In vitro drug release curves of HA/SA/CS composite microspheres loaded with DOX at different pH values. (C) Scaffold characteristics: SEM images (a1–a4); compression modulus and compressive strength (b); porosity and pore size (c); water absorption of microspheres (d) and hydrolysis (e) and enzymatic hydrolysis (f) in the degradation cycle (Compared with the control value, *p<0.05, **p<0.01, ***p<0.0001).
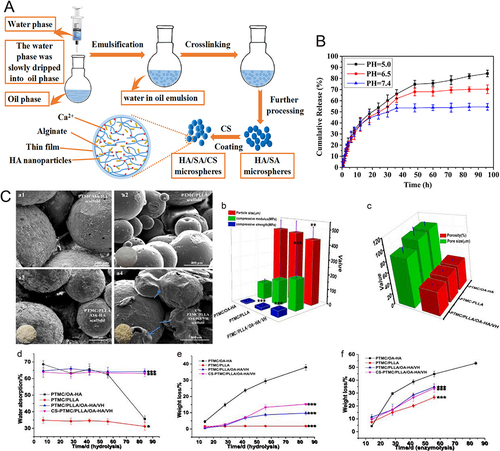
Figure 7 Synthesis of smooth agonist (SAG)-loaded oxidized liposome-coated PLGA scaffolds for bone transplantation to treat skull defects in mice.
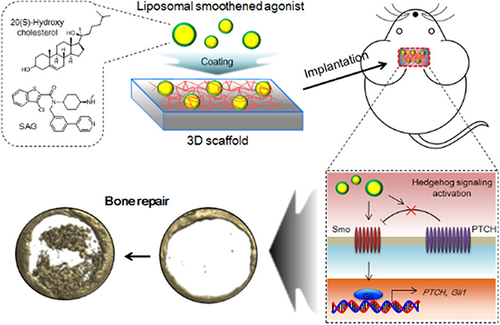
Figure 8 (A) During the incubation period of 4 weeks, the proliferation rate of hMSCs in polymer hydrogel and the alizarin red staining of its cells were observed. (B) The ALP activity and relative Runx2 and OPN gene expression of hMSCs cultured in BMP-2-treated or untreated hydrogels (mean ± SD, n = 3, *p<0.05, **p<0.01). (C) Extracellular simulation of in situ formation of injectable bio-coupled hydrogel loaded with BMP-2 and its sustained release to repair bone defects. (D) The concentration of BMP-2 in serum of SD rats at each time point.
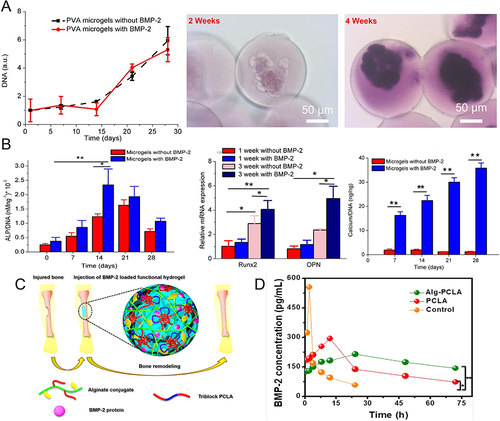
Figure 9 (A) Release of surface particles and accumulated magnesium ions and calcium ions during degradation by scaffold analysis. SEM images showed the morphology and particle distribution of the scaffold (a). Proportion ratio of each element in PTM stent (b) and cumulative release of Mg2+ (c) and Ca2+ (d). (B) Histological analysis of bone formation after stent implantation. Histological analysis of decalcified sections, in which the blue arrow shows new bone (a). Fluorescence microscope image of decalcified section, in which white arrow indicates bone formation (b). Quantitative analysis of new bone formation (c1–c4). n=3 in each group; compared with the control group, ***p<0.0001; compared with PT group, ##p<0.01, ###p<0.0001.
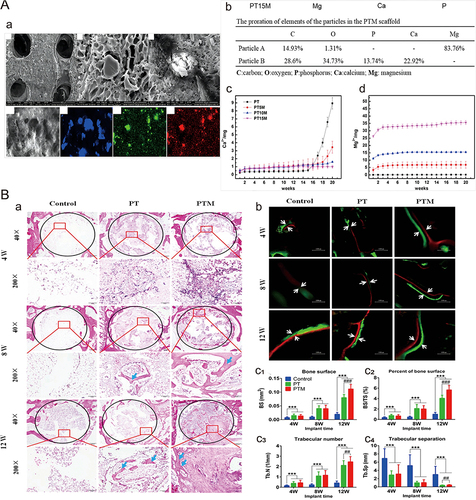
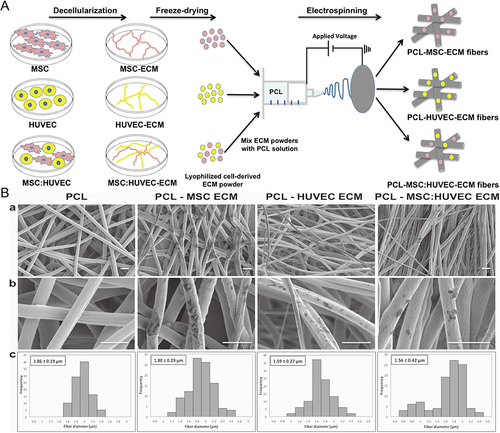
Figure 10 (A) Schematic of the fabrication of cell-derived ECM microfibrous scaffolds. (B) SEM observations at lower magnification (a) and at a higher magnification (b), and fiber diameter distributions (c) of ECM PCL electrospun scaffolds from different cell sources. Scale bar 5 μm.