Figures & data
Figure 1 Synthesis of HA-bFGF hydrogel. (A) The process of synthesis. (B) The appearance of the finished product. (C) The morphological structure of HA-bFGF hydrogel and HA hydrogel as detected by SEM. (D) FTIR spectra of HA and HA-bFGF. (E) HA-bFGF drug release curve.
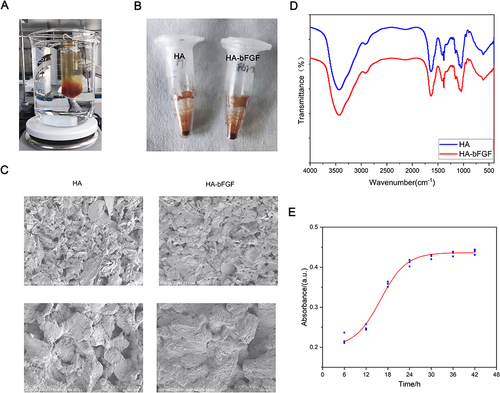
Figure 2 In vitro and in vivo biocompatibility testing of HA-bFGF hydrogel. (A) The morphological structure of neuroglial cells in the 4 groups. (B) MTT assays were performed to measure cell proliferation. OD values at 490 nm were determined at 0 h, 24 h, 48 h, and 72 h after drug administration. (C) ELISA assays were used to detect LDH activity. (D) Biocompatibility testing in vivo. HA and HA-bFGF were injected into rats in the different experimental groups. H&E staining was used to detect morphological changes in sections of heart, liver, lung, kidney, and spleen tissue.
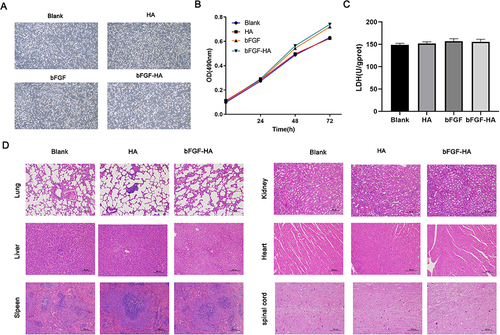
Figure 3 HA-bFGF hydrogel helped to repair spinal cord injuries in rats. (A) Spinal cord injury severity was evaluated by the BBB score at 3, 7, 14, 21, and 28 days after hydrogel administration. (B) The expression of inflammatory factors (IL-6, IL-1β, and TNF-α) in blood samples from rats in the different groups was examined by ELISA. (C) After 14 and 28 days of treatment, samples of injured spinal cord tissue were removed, stained with H&E, and examined under a microscope. (D) After 14 and 28 days of treatment, samples of injured spinal cord tissue were removed, subjected to Nissl staining, and examined under a microscope. Size bar, 500 μm.
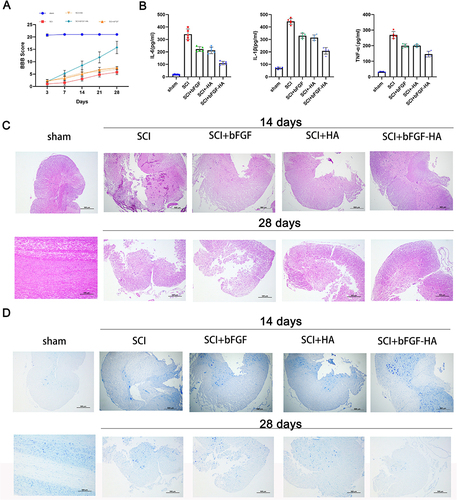
Figure 4 HA-bFGF hydrogel improved axon formation after a spinal cord injury. (A) The levels of TUBB3 (a marker for microglia) and GFAP (a marker for astroglia) after 14 and 28 days of treatment, respectively. (B) The expression of NAF200 and GAP43 (two marker genes for axons) and (C) MBP-Nogo-A (a marker gene for Schwann cells) after 14 and 28 days of treatment, respectively.
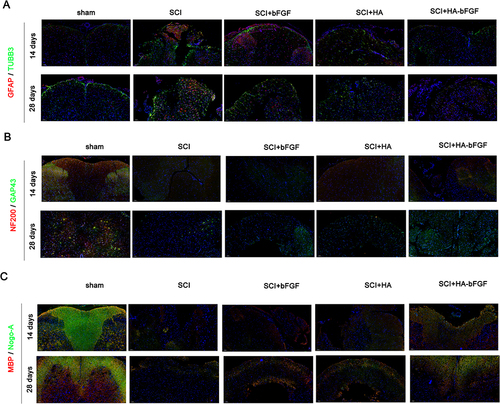
Figure 5 HA-bFGF hydrogel affected the expression of corresponding factors. (A) Western blot assays were performed to measure the levels of NAF200, GAP43, GFAP, and S100 expression. (B) A gray analysis of corresponding proteins (n = 3). ***P < 0.0001 between sham and SCI; #P<0.05, ###P<0.0001 between SCI and SCI+HA-bFGF. Size bar, 100 μm.
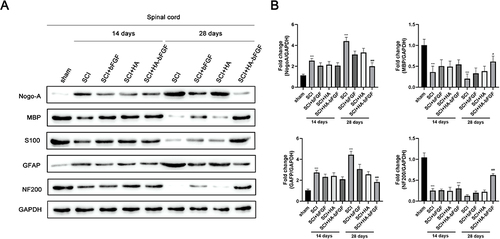
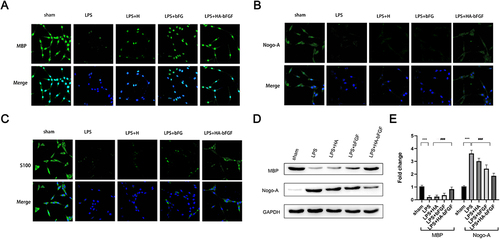
Figure 6 HA-bFGF facilitated the regeneration of myelin sheath of Schwann cells. (A) Immunofluorescence staining with MBP was used to detect morphological changes in cells under a confocal microscope. (B) Immunofluorescence assays were performed to detect the expression of Nogo-A, which influences generation of the myelin sheath. (C) Immunofluorescence assays were performed to detectS100 expression. (D and E) Western blot assays were performed to detect the levels of MBP and Nogo-A expression. (D) The representative images. (E) A gray analysis of MBP and Nogo-A (n = 3). ***P < 0.0001 between sham and LPS; ###P<0.0001 between LPS and LPS+HA-bFGF.