Figures & data
Figure 1 Results of single-factor screening. (A) poloxamer ratio, (B) soybean oil ratio, (C) lecithin ratio, (D) cut time, (E) homogeneous number and (F) homogeneous pressure on encapsulation efficiency of FA-SLN. Data are shown as mean ± SD (n = 3). **P < 0.01, ***P < 0.001, ****P < 0.0001.
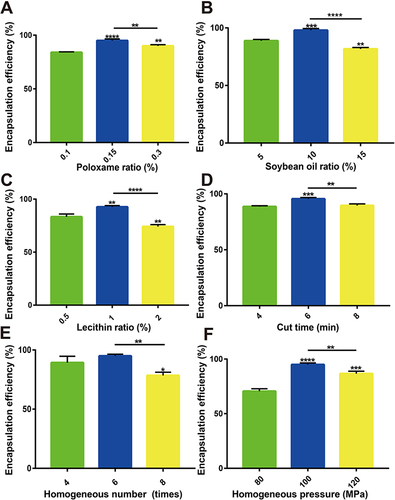
Figure 2 Effects of variables X1 and X2, and X3. (A–C) particle size (Y1) and (D–F) encapsulation efficiency (Y2) of stealth lipid nanospheres loaded with flurbiprofen axetil (FA-SLN), as determined by the center composite design method. X1, soybean oil ratio (%); X2, lecithin ratio (%); X3, homogeneous pressure (MPa).
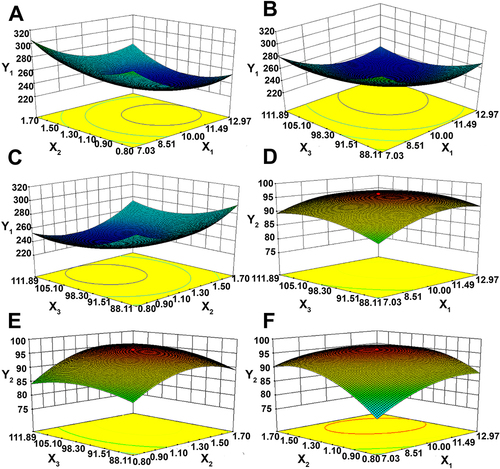
Figure 3 Fourier-transform infrared spectra of various formulations. DSPE-PEG-Mal+cRGD, the physical mixture of DSPE-PEG-Mal and cRGD.
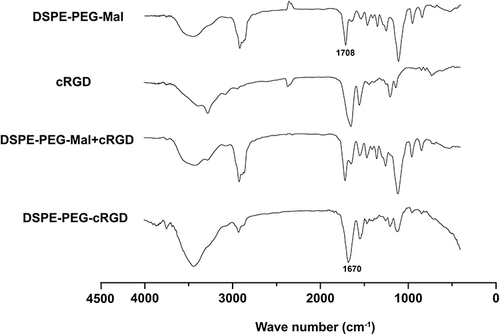
Figure 4 Particle size and morphology detection. (A) Particle size distribution and (B) transmission electron micrographs of LN, SLN, FA-SLN, and cRGD-FA-SLN. The bar is 100 nm.
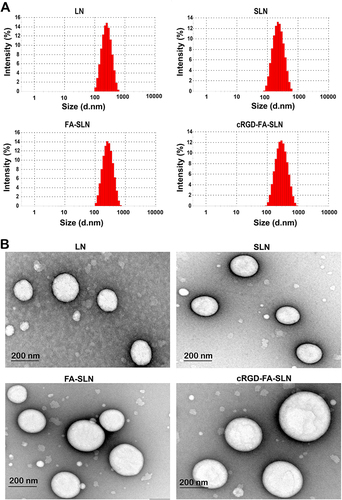
Figure 5 Cellular uptake detection. (A) Cellular uptake of FA-LN, FA-SLN, and cRGD-FA-SLN by quiescent and lipopolysaccharide-activated RAW264.7 macrophages (M1 type), as determined by confocal laser microscopy. (B) Frequency distributions of quiescent and M1-type RAW264.7 cells treated with different formulations.
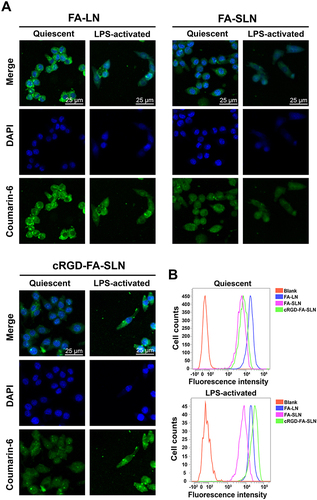
Figure 6 Pharmacokinetics of cRGD-FA-SLN in vivo. Changes in the concentration of flurbiprofen in the plasma from (A) the healthy and (B) collagen-induced arthritic (CIA) rats treated with FA, FA-LN, FA-SLN, or cRGD-FA-SLN. Data are shown as mean ± SD (n = 5).
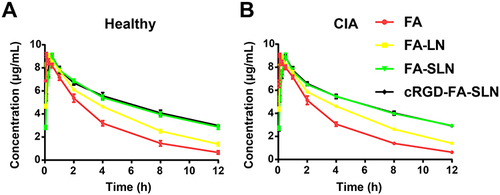
Figure 7 Effect of different formulations on RAW264.7 cell survival. (A) 24 h, (B) 48 h, and (C) 72 h post-administration, as determined by the MTT assay. Data are shown as mean ± SD (n = 3). *P < 0.05, **P < 0.01, ***P < 0.001, ****P < 0.0001 vs FA.
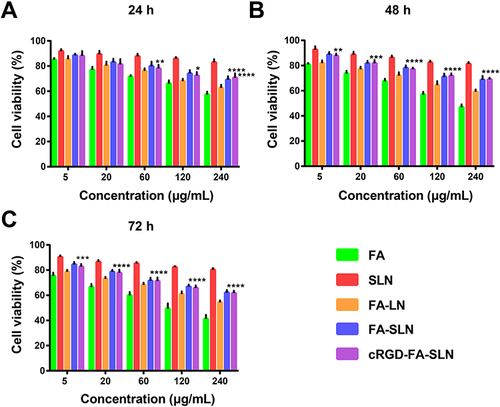
Figure 8 Biodistribution of different preparations in the tissues based on determination of flurbiprofen concentration. (A–C) Healthy and (D–F) collagen-induced arthritic (CIA) rats at 10 min, 4 h, and 8 h post-injection. Data are shown as mean ± SD (n = 5). *P < 0.05, **P < 0.01, ***P < 0.001, ****P < 0.0001; #P < 0.05, ###P < 0.001, ####P < 0.0001.
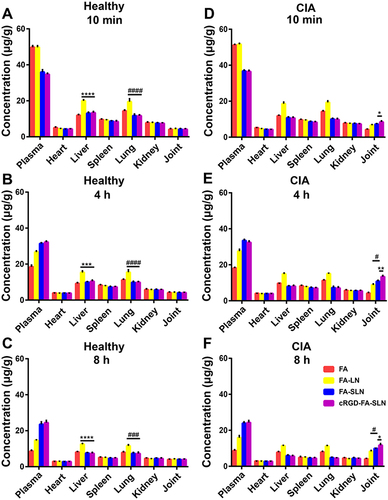
Figure 9 Biodistribution detection through the fluorescence measurements. (A) Biodistribution of DiR-labeled formulations in the tissues of healthy and collagen-induced arthritic (CIA) rats at 10 min, 4 h, and 8 h post-injection, as determined by in vivo fluorescence imaging. (B–E) Semi-quantitative analysis of fluorescence intensity in (B) healthy ankle joints, (C) inflamed ankle joints, (D) tissues of healthy rats, and (E) tissues of CIA rats. Data are shown as mean ± SD (n = 5). *P < 0.05, **P < 0.01, ****P < 0.0001. DiR, 1.1-dioctadecyl-3,3,3,3-tetramethylindotricarbocyanine.
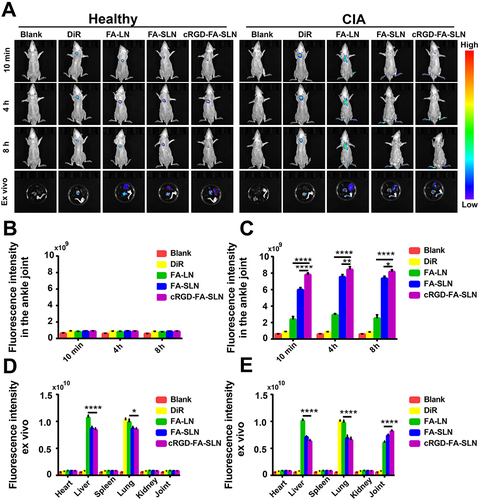
Figure 10 In vivo therapeutic efficacy of cRGD-FA-SLN. (A) Photographs of hind legs collected from rats in different treatment groups on day 34 after arthritis induction. (B–E) Changes in the (B) weight, (C) ankle diameter, (D) paw volume, and (E) articular index score over time. Data are shown as mean ± SD (n = 5). **P < 0.01, ****P < 0.0001 vs saline.
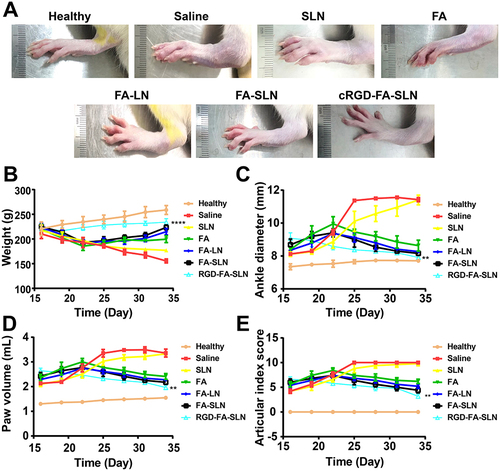
Figure 11 Micro-computed tomography detection of ankle joints. (A) Three-dimensional micro-computed tomography images of ankle joint bones. (B–G) Effect of different treatments on (B) bone mineral density (BMD), (C) ratio of bone surface area to bone volume (BS/BV), (D) ratio of bone volume to tissue volume (BV/TV), (E) trabecular thickness (Tb.Th), (F) trabecular number (Tb.N), (G) and trabecular spacing (Tb.Sp). Data are shown as mean ± SD (n = 5). ####P < 0.0001 vs saline; *P < 0.05, **P < 0.01, ***P < 0.001, ****P < 0.0001.
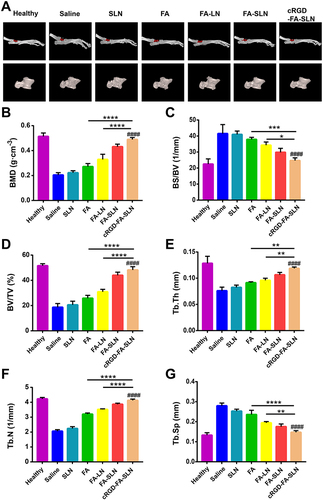
Figure 12 Histopathological changes in ankle joint tissues. (A) Hematoxylin–eosin and (B) safranin O staining of ankle joint tissues collected from rats after various treatments. (C) Histopathological scores in the different treatment groups. Data are shown as mean ± SD (n = 5). ####P < 0.0001 vs saline. ***P < 0.001, ****P < 0.0001 (cRGD-FA-SLN vs FA or FA-LN).
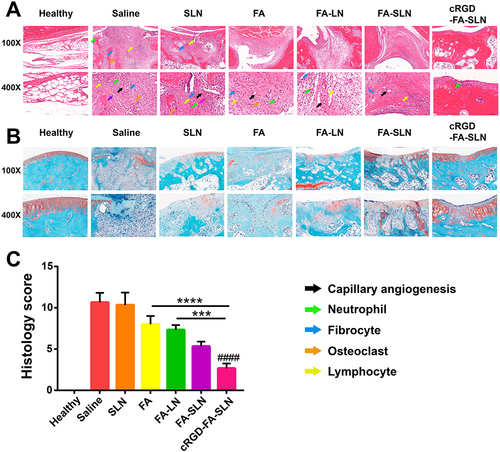
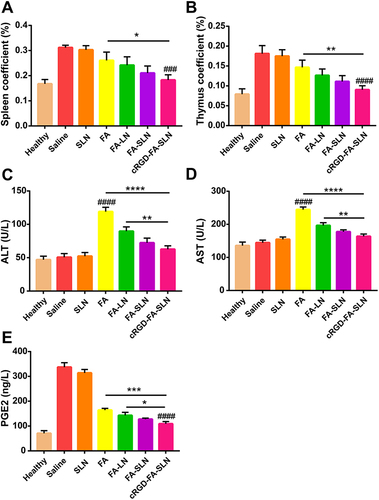
Figure 13 Effect of the different treatments on the (A) spleen coefficient, (B) thymus coefficient, as well as levels of (C) alanine aminotransferase (ALT), (D) aspartate aminotransferase (AST), and (E) prostaglandin E2 (PGE2). Data are shown as mean ± SD (n = 3). ###P < 0.001, ####P < 0.0001 vs saline; *P < 0.05, **P < 0.01, ***P < 0.001, ****P < 0.0001.