Figures & data
Figure 1 Schematic illustration of experimental design for HELNs isolation, and prediction of respiratory RNA viral genomes and human gene targeted by miRNAs in HELNs. Pictures of all the virus structures and genomes were obtained from ViralZone Available from: https://viralzone.expasy.org/. Creative Commons.
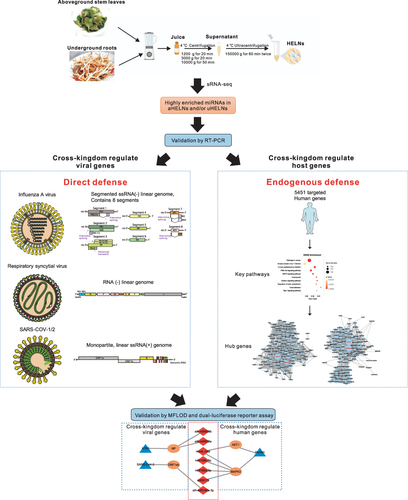
Figure 2 Characterization of uHELNs and aHELNs identified by (A and B) TEM, (C and D) NTA, and (E and F) Zeta potential. The white arrow referred to exosome-like nanoparticles.Scale bar = 200 nm.
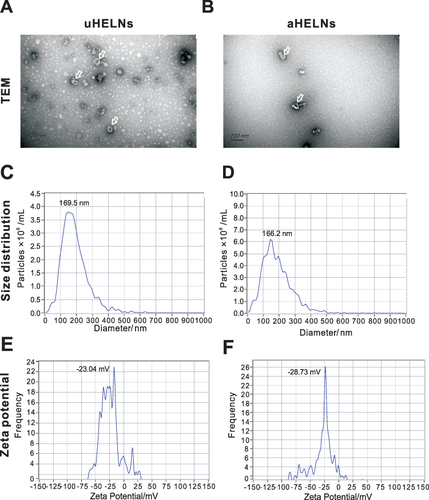
Table 1 Information of the High Abundant miRNAs*
Figure 3 Relative miRNA expression levels in uHELNs and aHELNs identified and validated by sRNA-seq and RT-PCR. miRNAs identified by sRNA-seq with read counts of more than (A)10,000, (B) 2000, and (C) 100. (D) Cycle threshold (Ct) values of each miRNA enriched in uHELNs and aHELNs validated by RT-PCR. Data are from three independent experiments. Error bars, SD, *p < 0.05, ***p < 0.001, **** p < 0.0001.
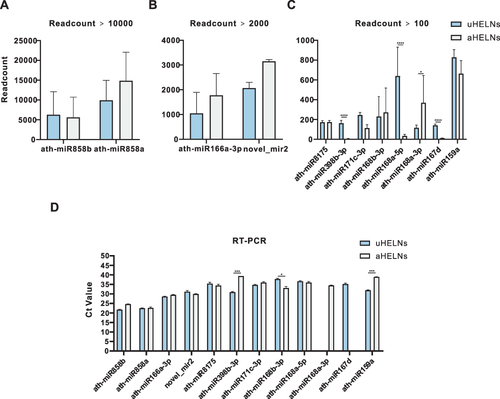
Table 2 Information of miRNAs Targeting H1N1
Figure 4 Prediction results of miRNAs in HELNs target influenza A virus (IAV) genome. (A–G) Structures and binding sites of miRNAs in HELNs (green) target H1N1 genome (red) with MEF ≤ −25 kcal/mol. (H–K) Homology comparison of miRNAs in HELNs target to other subtypes of IAV, including H5N1, H7N7, and H7N9. Seed sequence of miRNA was marked in red. (H) Seed sequence of miRNA only completely complement H1N1. (I) Seed sequence of miRNA completely complement to both H1N1 and H7N9. (J) Seed sequence of miRNA completely complement H1N1, H5N1, and H7N7. (K) Seed sequence of miRNAs complete complement H1N1, H5N1, H7N7, and H7N9. G: U allowed.
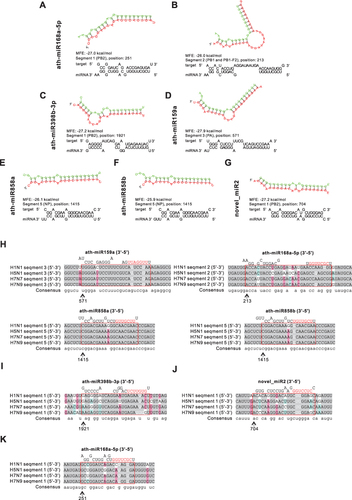
Table 3 Information of miRNAs Targeting Respiratory Syncytial Virus
Figure 5 Prediction results of miRNAs in HLENs target respiratory syncytial virus (RSV) genome. (A and B) Structures and binding sites of miRNAs in HELNs (green) target RSV genome (red) with MEF ≤ −25 kcal/mol. G: U allowed.
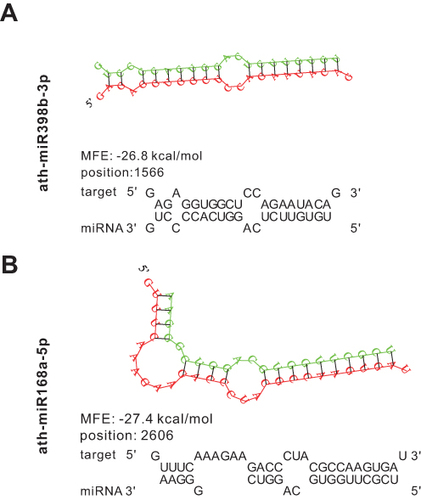
Table 4 Information of miRNAs Targeting SARS-CoV-2
Figure 6 Prediction results of miRNAs in HLENs target SARS-CoV-1/2. (A–C) Structures and binding sites of miRNAs in HELNs (green) target SARS-CoV-2 Omicron genome (red) with MEF ≤ −25 kcal/mol. (D–F) Homology comparison of miRNAs in HELNs target to other subtypes of B coronavirus, including SARS-CoV-1, SARS-CoV-2 Wuhan, Delta. Seed sequences of miRNA were marked in red.
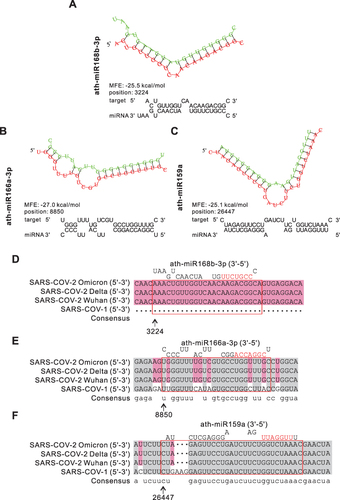
Figure 7 Bioinformatics analysis of the predicted human target genes of miRNAs in HELNs. (A) Venn diagram of common miRNA Target genes (TGs) predicted by RNAhybrid and Miranda. (B) Bubble of KEGG analysis of miRNA TGs. (C and D) Protein protein interaction (PPI) network of TGs involved in PI3K-AKT and MAPK signaling pathway. Genes marked in red were hub genes.
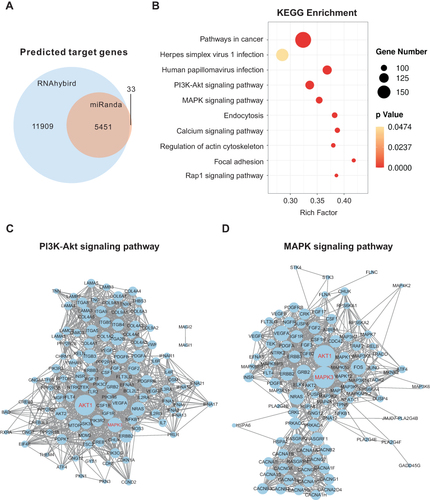
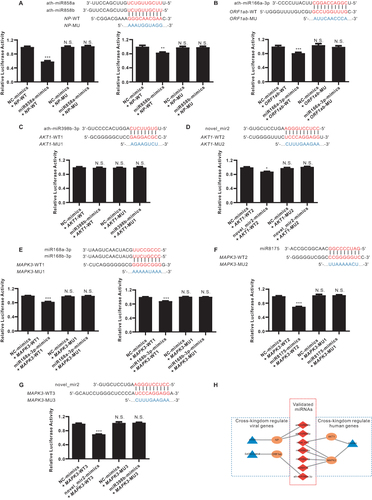
Figure 8 Validation of computationally predicted miRNAs and their target genes by using dual-luciferase assays. (A) 293T cells were co-transfected with the miR858a or miR858b mimic or negative control (NC) luciferase reporter vectors containing the wild-type (WT) or mutant (MU) NP sequence. (B) 293T cells were co-transfected with the miR166a-3p mimic or NC luciferase reporter vectors containing the WT or MU ORF1ab sequence. (C and D) 293T cells were co-transfected with the miR398b-3p and novel_mir2 mimic or NC luciferase reporter vectors containing the WT or MU AKT1 sequence. (E–G) 293T cells were co-transfected with the miR168a-3p, miR168b-3p, miR8175, and novel_mir2 mimic or NC luciferase reporter vectors containing the WT or MU MAPK3 sequence. Assays were repeated five times to ensure accuracy. The relative luciferase activities were normalized to that of the control group (NC-mimics with WT-target). Mean + SEM. *p < 0.05, **p < 0.01, ***p <0.001, N.S., no significant difference versus the control group. (H) Network schema of validated miRNAs (red), target genes (Orange), and species (blue).