Figures & data
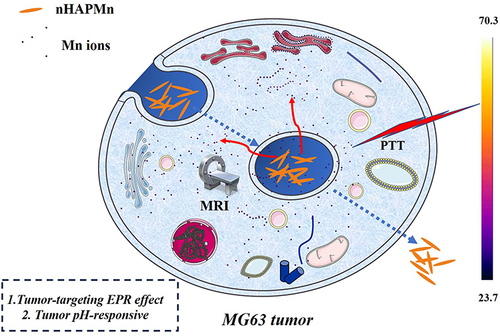
Figure 1 (a and b) Schematic of nHAPMn NPs for MRI-guided photothermal therapy.
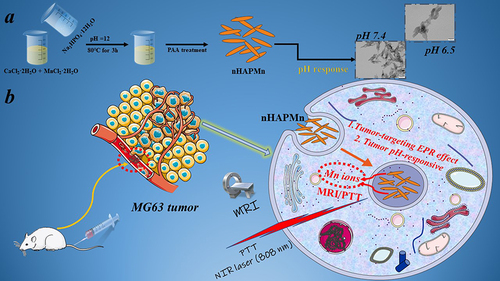
Table 1 Lattice Parameters, Crystallite Sizes, and Crystallinity from XRD Analysis
Figure 2 X-ray diffraction patterns of nHAP and nHAPMn.
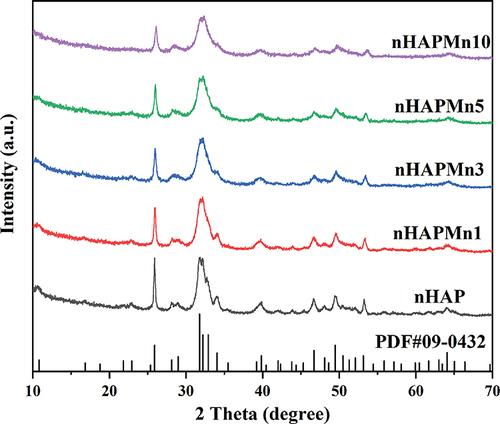
Figure 3 Field emission scanning electron microscopy (FE-SEM) images of the (a) pure nHAP, (b) nHAPMn1, (c) nHAPMn3, (d) nHAPMn5, and (e) nHAPMn10 samples and (f–i) EDX mapping of nHAPMn5.
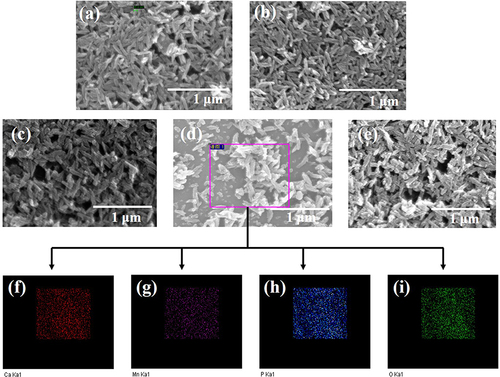
Figure 4 Transmission electron microscopy (TEM) (a) and high-resolution (HR) TEM (b) images of nHAPMn5.
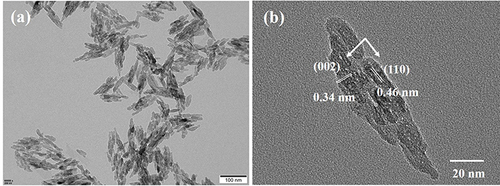
Figure 5 Dynamic light scattering (a) and zeta potentials (b) of nHAP and nHAPMn.
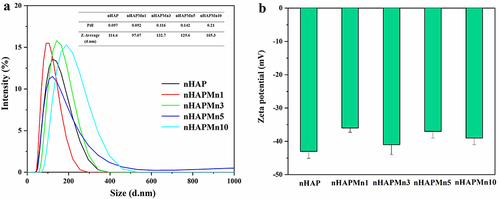
Figure 6 Fourier transform infrared (FT-IR) spectra of nHAP and nHAPMn.
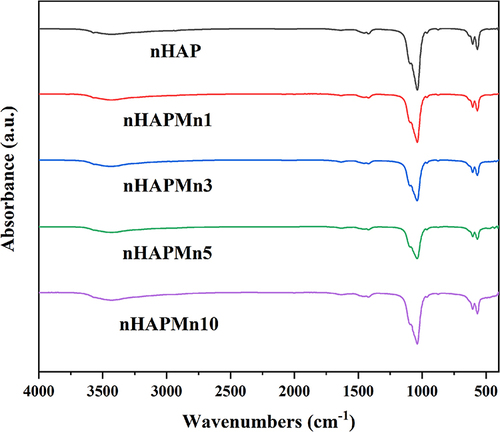
Figure 7 X-ray photoelectron spectroscopy (XPS) survey scan and theoretical calculation of nHAPMn5.
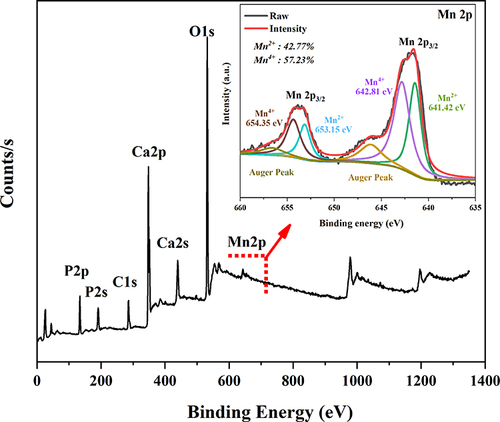
Figure 8 Ultraviolet–visible–NIR (UV–vis–NIR) absorption spectra of nHAP and nHAPMn.
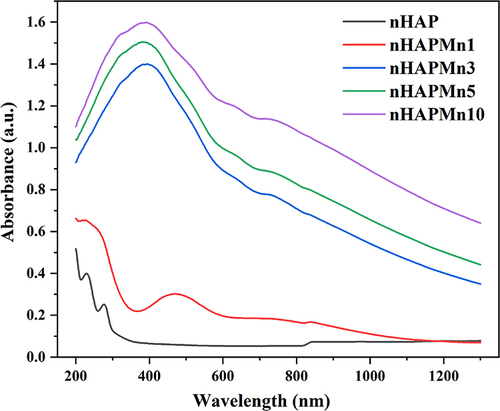
Figure 9 Magnetization curves of nHAP and nHAPMn powders measured at room temperature.
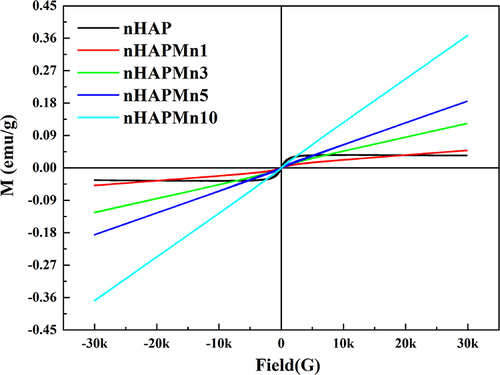
Figure 10 In vitro MRI studies of nHAPMn5 treated with PBS (pH 6.5 and 7.4). Inset: T1-weighted MR images of nHAPMn5 at various Mn ions concentrations (0, 0.25, 0.5, 1.5, and 2.5 mM) and different PBS conditions (pH 6.5 and 7.4).
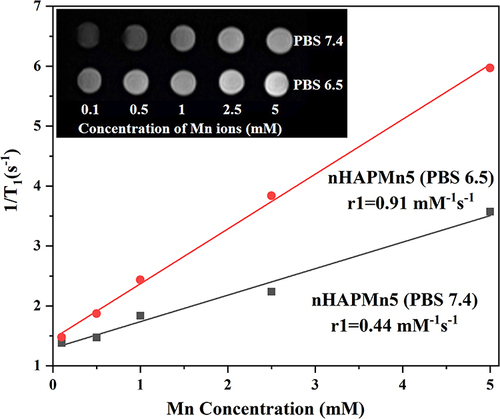
Figure 11 (a) Heating properties of the nHAPMn solution with various Mn ion doping concentrations during irradiation with an 808 nm laser (1 W/cm2), (b) corresponding infrared thermal images of the nHAPMn solution with various Mn ion doping concentrations during irradiation with an 808 nm laser (1 W/cm2), (c) temperature increase of the nHAPMn5 solution irradiated with various power densities using an 808 nm laser, (d) corresponding heating and cooling curves and fitted line based on the data in the cooling stage, (e) thermal stability of nHAPMn5 during five on and off cycling processes.
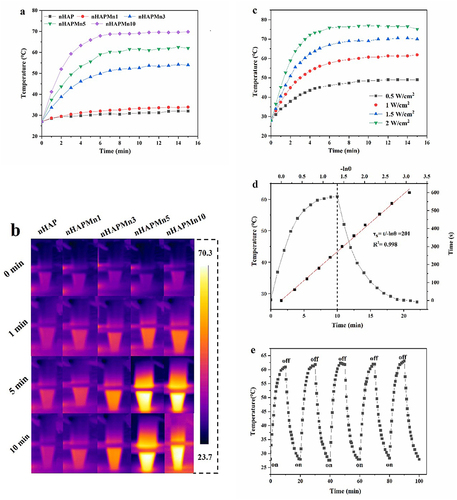
Figure 12 (a) CCK-8 assay of MC3T3-E1 cells after incubation with nHAP and nHAPMn (100 μg/mL) after 1, 2, and 3 days of treatment. (b) Hemolysis of nHAPMn5 NPs after incubation with red blood cells at various concentrations.
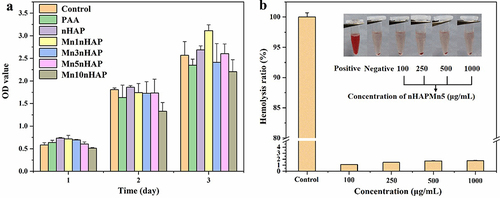
Figure 13 (a) Cell viability of the MG63 cells treated with nHAPMn5 at different concentrations under an 808 nm laser (1 W/cm2) (*P<0.05, **P<0.01, ***P<0.001) and (b) corresponding fluorescence images of the MG63 cells stained with Calcein-AM and PI. Scale bar = 50 μm.
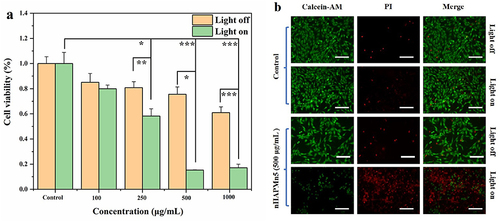
Figure 14 (a) T1-weighted MR coronal images of tumor-bearing mice at different times after intravenous injection of nHAPMn5 and (b) corresponding T1-weighted MRI-signal intensities.
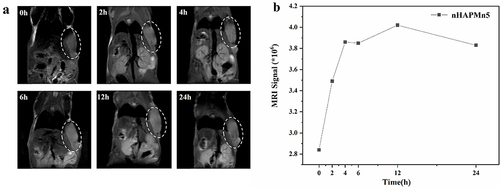
Figure 15 (a) Temperature rise curve in the irradiated area of tumor-bearing mice injected with PBS and nHAPMn5 (10 min, 1 W/cm2, the inset corresponds to the infrared thermogram), (b) changes in the relative tumor volume of each group of tumor-bearing mice, and (c) images of tumor changes in mice before and after treatment. (d) Weight of mice within 14 days, and (e) images of tumor tissues in the above four groups analyzed by hematoxylin-eosin staining (H&E, scale bar=100 μm).
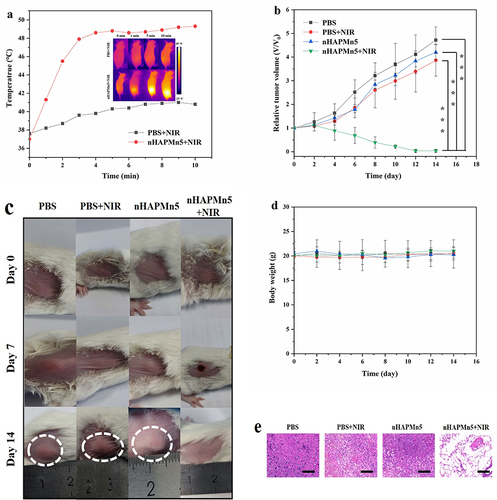
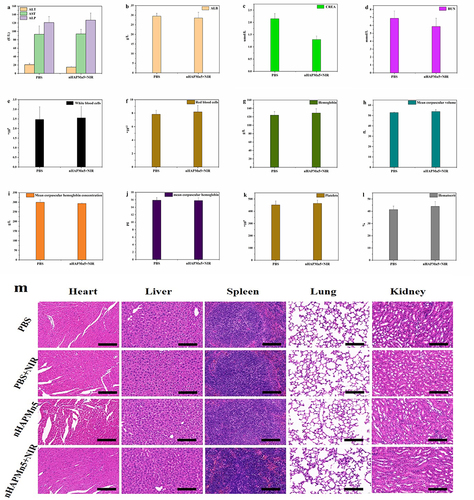
Figure 16 (a and b) Liver function (ALT, AST, alkaline phosphatase (ALP), and ALB) and (c and d) kidney function (CREA and blood urea nitrogen (BUN)) of tumor-bearing mice. (e–l) Data of complete blood counts: white blood cells (WBCs), red blood cells (RBCs), HGB, mean corpuscular volume (MCV), mean corpuscular hemoglobin concentration (MCHC), mean corpuscular hemoglobin (MCH), PLT, and HCT. (m) H&E staining images of the primary organs 14 days after the injection of nHAPMn5 (scale bars: 100 μm).