Figures & data
Scheme 1 Schematic illustration of the CS/GP@CN hydrogel for PTT therapy and activating dendritic cells mature and leading to an antitumor immunity effect.
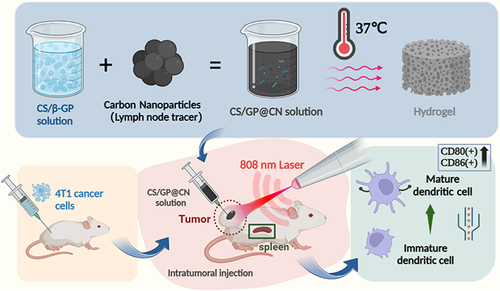
Figure 1 Characterization of hydrogels. (A) Photographs of the gelation behavior of Gel at 37 °C. (B) and (C) Photographs of injectable property in vitro. (D)TEM image of CNSI (scale bar = 100 nm). SEM images focused on the cross-section of (E) CNSI (scale bar = 200 nm) and (F) CS/GP@CN Gel (scale bar = 50 µm). (G) The dynamic temperature sweep tests and (H) the dynamic time sweep tests of CS/GP Gel. (I) The FTIR spectra of CS/GP Gel.
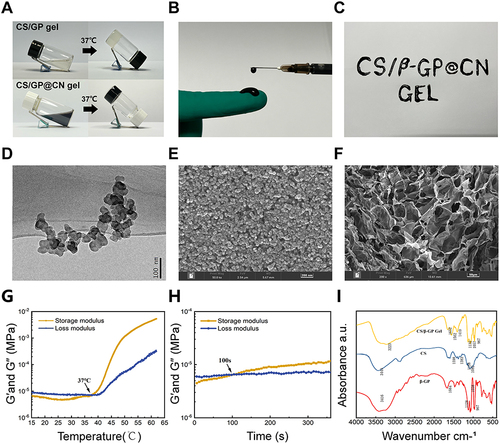
Figure 2 In vitro photothermal performance of CS/GP@CN Gel. (A) Temperature changes of PBS, CN-free, CS/GP@CN Gel under irradiation at 808 nm (1.0 W/cm2, 5min). (B) Temperature changes of different concentration of CNSI in CS/GP@CN Gel under irradiation at 808 nm (1.0 W/cm2, 5min). (C)Temperature changes of CS/GP@CN Gel under irradiation with three different density of laser power (0.5 W/cm2, 1 W/cm2 and 2 W/cm2). (D) Photostability of CS/GP@CN Gel under 808-nm laser irradiation (1 W/cm2). (E) The linear regression curve of the temperature cooling time (t) vs - ln(θ) of CS/GP@CN Gel. (F) Representative thermographic images of different concentration of CNSI in CS/GP@CN Gel under irradiation at 808 nm (1.0 W/cm2, 5min).
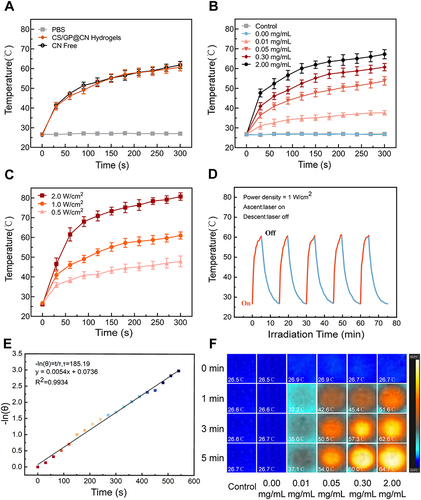
Figure 3 In vitro cytotoxicity and photothermal therapy effect. (A) CCK-8 assays of B16 and 4T1 cells after incubation with CS/GP@CN Gel for 24h and 48h. (B)Relative viabilities of B16 and 4T1 cells after incubation with different concentrations of CS/GP@CN Gel and subsequent exposure to 808-nm light at a power density of 0.3 W/cm2 for 3 min. (C) Cell viability of 4T1 cells after different treatments (**p<0.01, ***p<0.001, ****p<0.0001) (D)Confocal images of Calcein AM/PI-stained 4T1 cancer cells after incubation after different treatments. Scale bar: 200 μm.
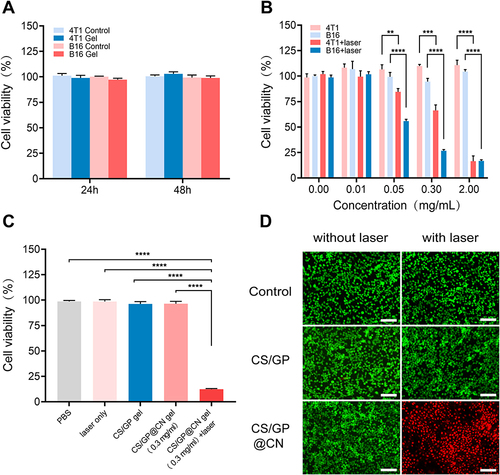
Figure 4 In vivo antitumor therapy. (A) Infrared thermal images of tumor-bearing mice with different treatments: (1) saline, (2) laser only, (3) CS/GP gel, (4) CS/GP@CN gel (CNSI of 0.3 mg/mL), (5) CS/GP@CN gel (CNSI of 0.3 mg/mL) +laser. (808 nm, 1 W/cm2, within the first 5 min). (B) Photographs of 4T1 tumor-bearing mice in each group. (C) Photographs of tumors after different treatments. (D) Tumor growth curve after different treatments (*p<0.05). (E) Body weight of mice after different treatments (***p<0.001). (F) H&E staining of lungs, livers, spleens, kidneys, hearts and tumor tissue slices after different treatments, scale bar = 100µm.
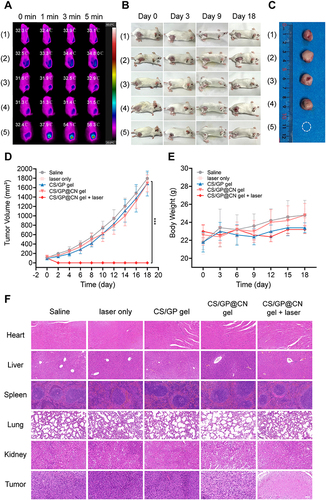
Figure 5 (A) Ki67 and (B) TUNEL of tumor tissue slices after different treatments: (1) saline, (2) laser only, (3) CS/GP gel, (4) CS/GP@CN gel (CNSI of 0.3 mg/mL), (5) CS/GP@CN gel (CNSI of 0.3 mg/mL) +laser. (808 nm, 1 W/cm2, 3 min), scale bar = 100 µm. (C) Relative Ki67-positive cells and (D) TUNEL-positive cells in tumor tissues after different treatments (**p<0.01, ***p<0.001).
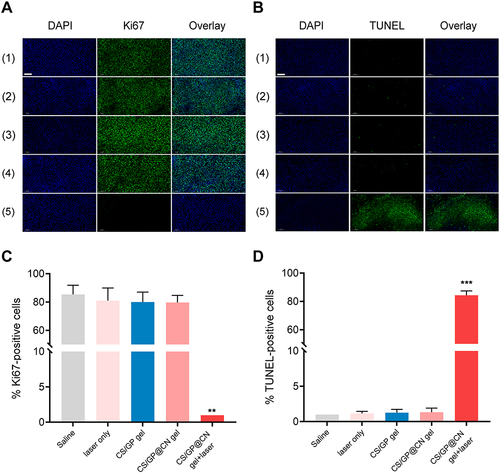
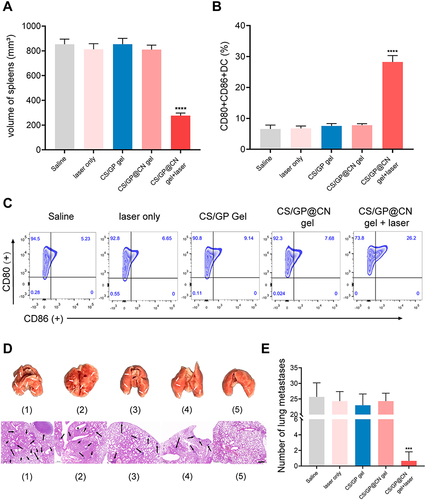
Figure 6 (A) volume of spleens obtained from mice in different treatment groups. (B) Quantification of CD80 and CD86 expression and (C) representative FACS plots on dendritic cells gated by CD11c+ cells. (D) General Photographs of lungs and H&E-stained lung sections from 4T1 tumor-bearing mice after indicated treatments on day 35. Tumor metastases in the H&E stained lung slices are indicated by black arrows. Scale bar = 500 µm. (E) Quantitative analysis of tumor metastases in the H&E stained lung slices (***p<0.001, ****p<0.0001).