Figures & data
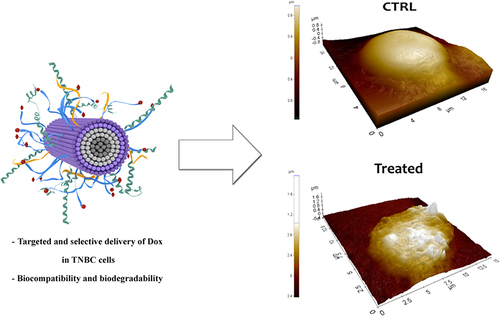
Table 1 Peptide Sequence of Self-Assembled Peptides P1–P6
Figure 1 (A) reports the peptide sequence of structural peptides P1 and P2. (B) reports the hypothetical assembly of the two structural peptides in aqueous solution below and above their critical aggregation concentration (CAC). Molecular models were obtained by CYANA structure calculation algorithm that uses torsion angle molecular dynamics for the efficient computation of three-dimensional structures.
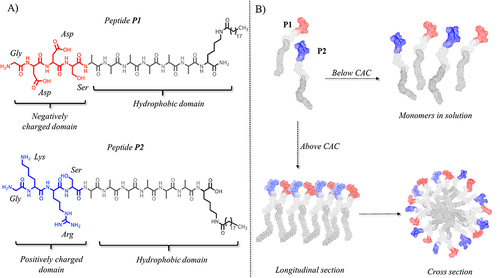
Figure 2 (A–D) report the CAC of nanofibers P1+P2+P3 (50:45:5) and P1+P2+P3+P6 with different percentages (1, 2.5, and 5%) of P6. CAC values were obtained plotting each maximum emission fluorescence corresponding to the wavelength (y) as a function of the peptide concentration using the sigmoidal Boltzmann equation. (E and F) report the nanofiber preparation monitored with ThT assay and the zeta potential measured for each nanofiber preparation, respectively.
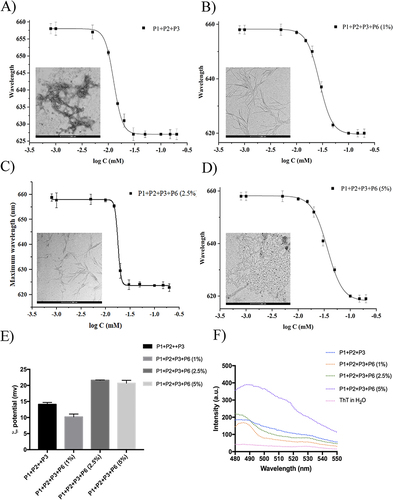
Table 2 Representation of Sequences of PAs Designed to Decorate the Surface of TNBC-Targeted Nanofibers
Table 3 Formulations, Critical Aggregation Concentrations (CACs) and Nanofiber
Figure 3 Fluorescent microphotographs showing the cellular uptake of the NFs into human TNBC cells. MDA-MB-231 cells were treated with NFs (1% of P6 peptide) (A–C), NF (2.5% of P6 peptide) (D–F) and NF (5% of P6 peptide) (G–I) at 50 µM for 1 h. Nuclei are shown in blue, stained with DAPI. The fluorescence (GFP) of NFs coupled with Fam is shown in green. Merged images derived from the overlapping of the two fluorescent emissions. The images shown are representative of three independent experiments. (J) Percentage of Green Fluorescence after the treatments in vitro. **p<0.01 vs 1% of P6 peptide treated cells; ***p<0.001 vs 1% of P6 peptide treated cells.
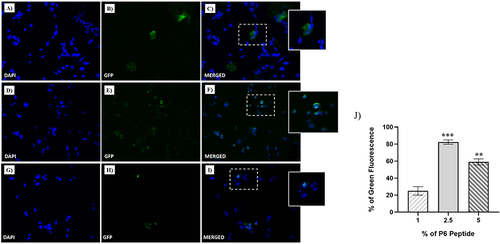
Figure 4 NF cellular uptake in MDA-MB-231 by confocal microscopy. TNBC cells were treated with NFs (2.5% of P6 peptide) at 50 µM for 1 h. Nuclei are shown in blue, stained with DAPI (A). NF is depicted in green (B). Merged images (C) derived from the overlapping of the two fluorescent emissions. Fluorescent microphotographs (63×oil immersion objective lens) are representative of three independent experiments.
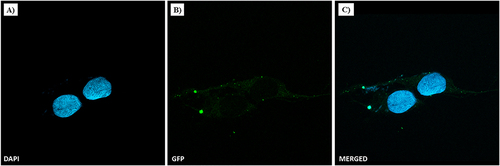
Figure 5 Cell survival index, evaluated by the MTT assay and monitoring of live/dead cell ratio for (A) HaCaT and (B) MDA-MB-231 cell lines treated for 48 and 72 h with the indicated concentration (the range 1→50 μM) of NF (at different percentage of P6 peptide: 1, 2.5 and 5%), P1+P2, P1+P2+P3, and P1+P2+P6 (at different percentage of P6 peptide: 1, 2.5 and 5%), as indicated in the legend. Data are expressed as percentage of untreated control cells and are reported as mean of four independent experiments ± SEM (n=24).
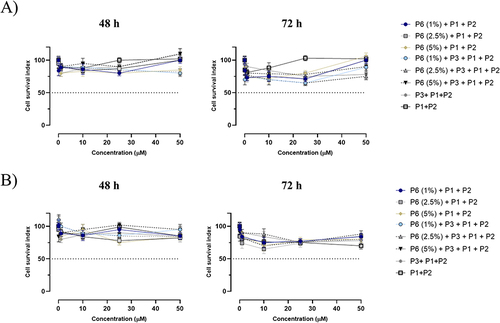
Figure 6 (A) reports the CAC and TEM image of nanofibers NF-Dox. (B) compares the zeta potential of nanofibers P1+P2+P3+P6 (2.5%) and NF-Dox.
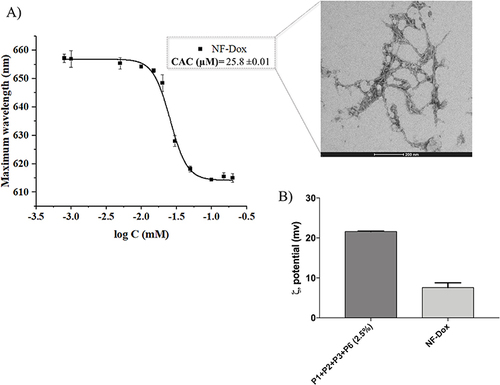
Figure 7 (A and B) report the CD spectrum of NF-Dox at the concentration of 100 µM and the stability of β-aggregates under the dilution effect, respectively.
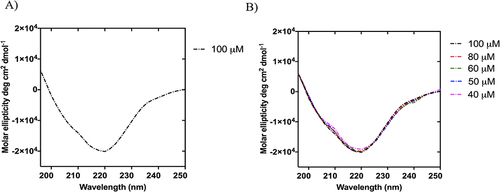
Figure 8 The spectral curve of the amide I band of NF-Dox (grey line) and its fitting curve (pink line) showing the 1700–1600 cm−1 spectral range (A). In (B), the table reports the multi-peak fitting results and their assignment for the secondary structure determination.
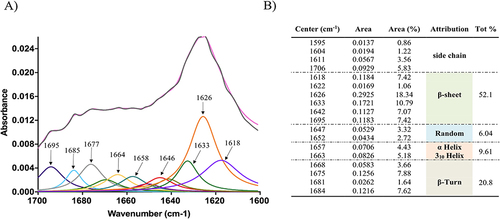
Figure 9 Structural studies of NF-Dox under the effect of ionic strength (A), pH environments (B), and temperature effect (C).
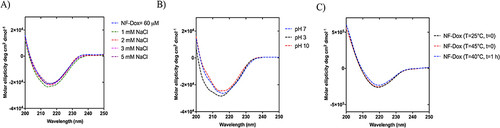
Figure 10 (A) reports the percentage of the intact peptide after the incubation with trypsin calculated by the integration of the HPLC peaks correlated to the peptide P3 and gH625. (B and C) report the percentage of the intact peptides P3, gH625, P6 and P22 after incubation with chymotrypsin.
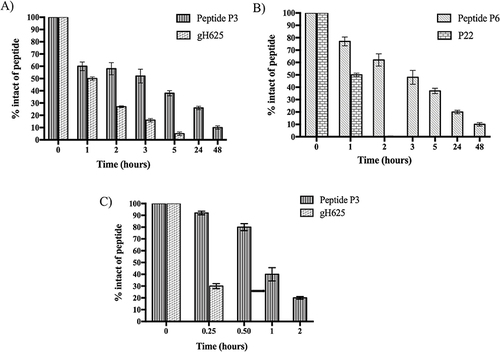
Figure 11 Cell survival index, evaluated by the MTT assay and monitoring of live/dead cell ratio for (A) MDA-MB-231, (B) HaCaT cell lines treated for 48 and 72 h with a range of concentration of free-Dox (Dox) from 1 to 7.5 μM) and NF-Dox (from 1 to 50 μM, ie from 1 to 7.5 μM of Dox), as indicated in the legend. Data are expressed as percentage of untreated control cells and are reported as mean of four independent experiments ± SEM (n=24). *p<0.05 vs control cells; **p<0.01 vs control cells; ***p<0.001 vs control cells; §p<0.05 vs Dox-treated cells; §§p<0.01 vs Dox-treated cells.
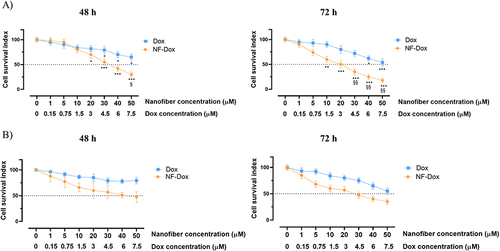
Figure 12 Cell survival index for MDA-MB-231 cells following 72 h of incubation with NF-Dox and free-Dox, as indicated in the legend. Data are expressed as percentage of untreated control cells and are reported as mean of four independent experiments ± SEM (n=24). ***p<0.001 vs control cells.
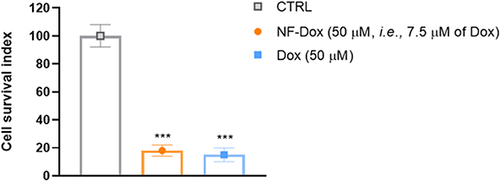
Figure 13 SEM images, AFM images and 3D reconstruction of a representative untreated MDA-MB-231 cell used as control sample (A–C); a representative cell treated with the NF platform without Dox (D–F); and a representative cell treated with the NF platform with Dox (G-I).
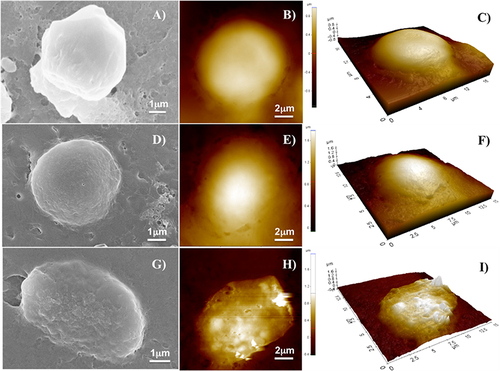
Figure 14 Cell survival index for MDA-MB-231 and HaCaT cell lines pre-treated or not with 40 nM of MMP-9 activated enzyme for 24 h and then incubated with NF-Dox (50 µM) for 72 h. #p<0.05; ##p<0.01.
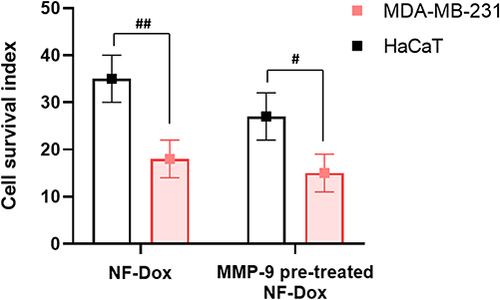
Figure 15 Fluorescent microphotographs showing the cellular location of doxorubicin (Dox) into human MDA-MB-231 cells following to free-Dox (A–C), NF-Dox (D–F) and P1+P2+P3+Dox (G–I) application. MDA-MB-231 were incubated with free- Dox (7.5 μM), NF-Dox and P1+P2+P3+Dox (50 µM, ie, 7.5 µM of Dox) for 1 h. Nuclei are shown in blue, stained with DAPI. The intrinsically fluorescence (RFP) of Dox is shown in red. Merged images derived from the overlapping of the two fluorescent emissions are. The images shown are representative of 3 independent experiments.
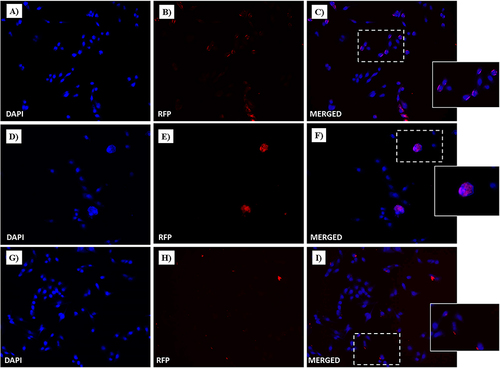
Figure 16 Fluorescent microphotographs showing the cellular location of Dox into human HaCaT cells following to free-Dox (A–C), NF-Dox (D–F) and P1+P2+P3+Dox (G–I) application. HaCaT were incubated with free- Dox (7.5 μM), NF-Dox and P1+P2+P3+Dox (50 µM, i.e., 7.5 µM of Dox) for 1 h. DAPI is used as a nuclear stain (shown in blue). The intrinsically fluorescence of Dox (RFP channel) is shown in red. Merged images derived from the overlapping of the two fluorescent emissions. The images shown are representative of 3 independent experiments.
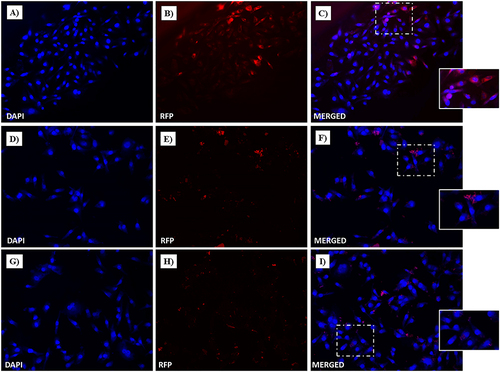
Figure 17 Fluorescent microphotographs showing the cellular location of Dox into human MDA-MB-231 TNBC cells after cellular up-take inhibition low temperature (4 °C) and then to free-Dox (A–C), NF-Dox (D–F) and P1+P2+P3+Dox (G–I) application. MDA-MB-231 were incubated with free-Dox (7.5 μM), NF-Dox and P1+P2+P3+Dox (50 µM, ie, 7.5 µM of Dox) for 1 h. Nuclei are shown in blue, stained with DAPI. The intrinsically fluorescence of Dox (RFP channel) is shown in red. Merged images derived from the overlapping of the two fluorescent emissions. The images shown are representative of 3 independent experiments.
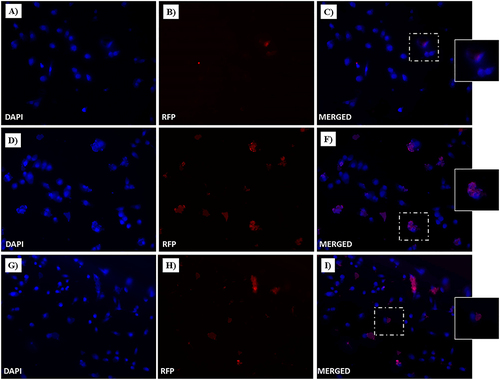
Figure 18 Fluorescent microphotographs of monolayers showing the cellular location of doxorubicin (Dox) into human MDA-MB-231 TNBC cells after cellular up-take inhibition sodium azide and then to free-Dox (A–C), NF-Dox (D–F) and P1+P2+P3+Dox (G–I) application. MDA-MB-231 were incubated with free-Dox (7.5 μM), NF-Dox and P1+P2+P3+Dox (50 µM, ie, 7.5 µM of Dox) for 1 h. Nuclei are shown in blue, stained with DAPI. The intrinsically fluorescence of Dox (RFP channel) is shown in red. Merged images derived from the overlapping of the two fluorescent emissions. The images shown are representative of 3 independent experiments.
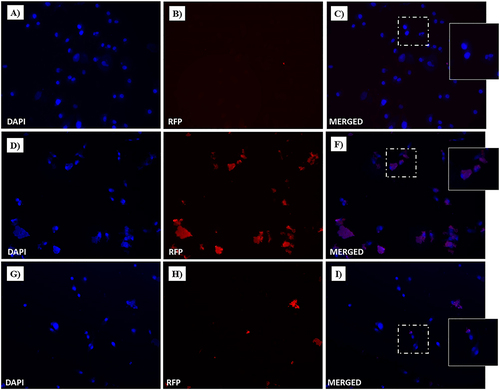
Figure 19 Dox nuclear localization in MDA-MB-231 cells by confocal microscopy. Cells were incubated with free-Dox (at 7.5 μM) (A–C) and NF-Dox (at 50 µM, ie, 7.5 µM of Dox) (D–F) for 1 h. Nuclei are stained in blue with DAPI. The intrinsically fluorescence of Dox is shown in red (RFP channel). Merged images derived from the overlapping of the two fluorescent emissions. Fluorescent microphotographs (63× oil immersion objective lens) are representative of three separate experiments.
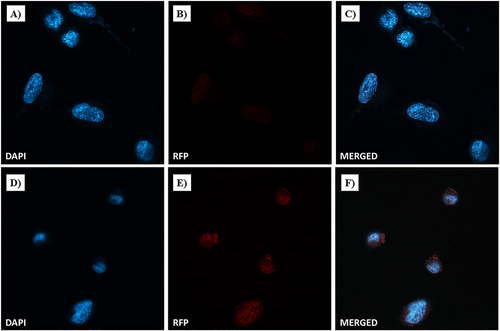
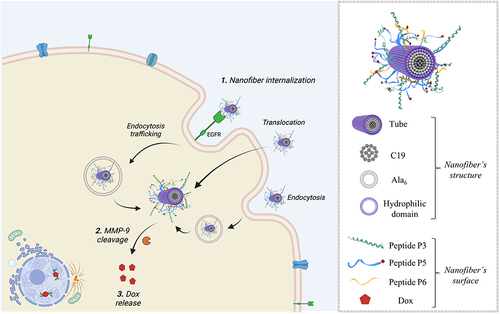
Figure 20 Representation of the hypothesized mechanism of the NF-Dox internalization and activity against TNBC (on the left), showing the different pathways which lead to the intracellular release of NF-Dox. On the right, the structure of the nanofiber with indicated all the moieties on the surface. The figure was created with Biorender.com (License: Academic Individual Plan x 3yrs (Feb 27, 2023 – Feb 27, 2026).