Figures & data
Scheme 1 Schematic diagram of (A) synthesis of SERS probe and (B) SERS-based immunoassay used to detect insulin antibodies and C-peptide antibodies.
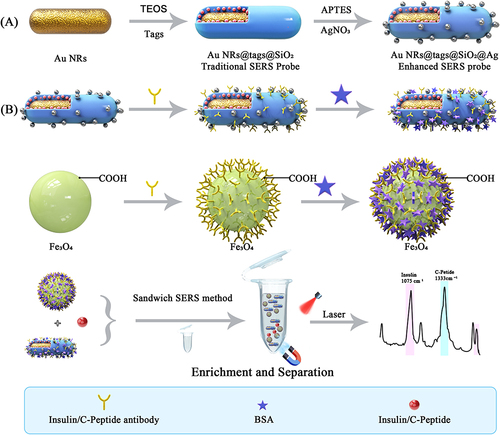
Figure 1 (A) Transmission electron microscopy (TEM)image of Au NRs; (B) Transmission electron microscope image of Au NRs@4-MBA/DTNB@SiO2; (C) Transmission electron microscope image of Au NRs@4-MBA/DTNB@SiO2 @Ag; (D) UV-vis spectra of Au NRs, Au NRs@4-MBA@SiO2, Au NRs@DTNB@SiO2, Au NRs@4-MBA @SiO2@Ag and Au NRs@DTNB@SiO2 @Ag; (E) Raman spectra of 4-MBA solution (0.01M), Au NRs, Au NRs@4-MBA@SiO2, Au NRs@4-MBA@SiO2@Ag; (F) Raman spectra of DTNB solution (0.01M), Au NRs, Au NRs@DTNB@SiO2, Au NRs@DTNB@SiO2@Ag.
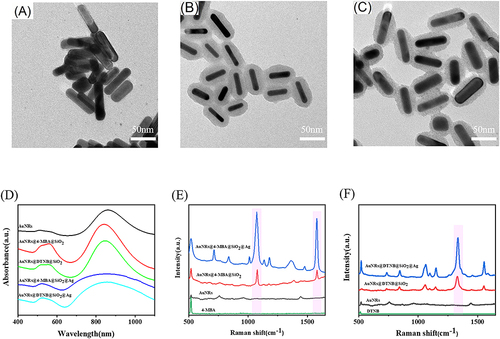
Table 1 Comparison of This Work and Other Methods Used in Insulin and C-Peptide Detection
Figure 2 (A) SERS spectrum of Au NRs@4-MBA@SiO2@Ag@insulin antibody response to different concentrations of insulin (4.29 pM, 0.429 pM, 4.29×10⁻² pM, 4.29×10⁻³ pM, 4.29×10⁻⁴ pM, 4.29×10⁻⁵ pM); (B) SERS spectrum of Au NRs@DTNB@SiO2@Ag @C-peptide antibody responds to different concentrations of C-peptide (1.76×10⁻³ nM, 1.76×10⁻⁴ nM, 1.76×10⁻⁵ nM, 1.76×10⁻⁷ nM, 1.76×10⁻⁹ nM, 1.76×10⁻¹⁰ nM); (C) The calibration curve of peak intensity at 1075 cm−1 varies with the lg value of insulin concentration;(D) Calibration curve of peak intensity at 1333 cm−1 varies with lg value of C-peptide concentration.
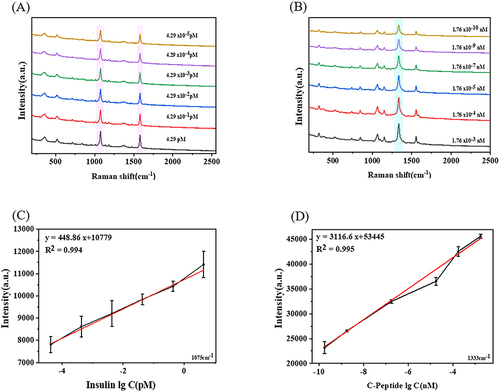
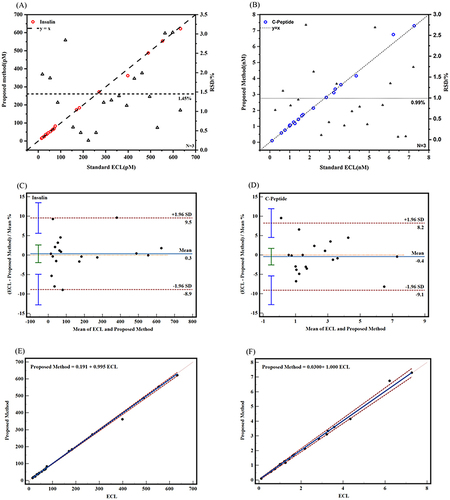
Figure 3 The results of serum insulin (A) and C-peptide (B) were compared with those of the clinical reference method (chemiluminescence method). Bland-Altman charts (C and D) and Pass-Bablok regression (E and F) were used for consistency analysis of the two detection methods.
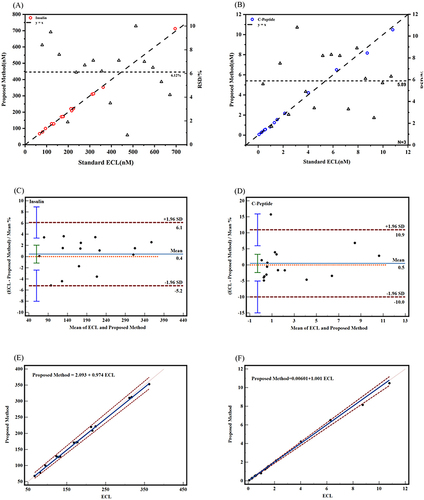
Figure 4 The results of serum insulin (A) and C-peptide (B) were compared with the results of clinical reference detection method (chemiluminescence method). Bland-Altman charts (C and D) and Pass-Bablok regression (E and F) were used for consistency analysis of the two detection methods.