Figures & data
Table 1 DC%, DE%, DL%, and process YE% of shikonin-loaded NPs before and after modification
Table 2 The kinetics models used to fit the release data
Figure 1 Schematic illustration of PEGylation and antibody conjugation.
Notes: (A) Activation of acid-terminated PLGA NPs by EDC and NHS. (B) One-step PEGylation and antibody conjugation. (C) Two-step PEGylation and antibody conjugation.
Abbreviations: Ab, antibody; EDC, N-(3-dimethylaminopropyl)-N′-ethylcarbodiimide hydrochloride; FSN, fluorescein; NHS, N-hydroxysulfosuccinimide sodium salt; NP, nanoparticle; PEG, polyethylene glycol; PLGA, poly(lactic-co-glycolic acid); SHK, shikonin; scFv, single-chain variable fragment.
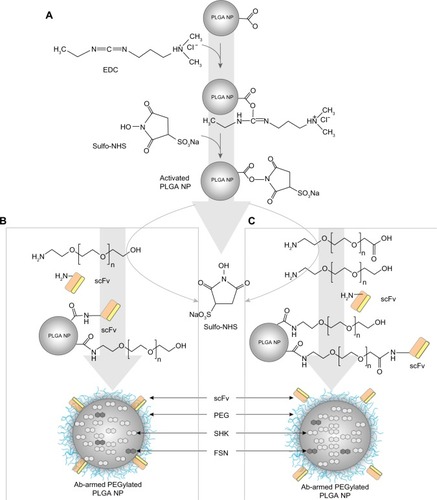
Figure 2 Size distribution and zeta potential of PLGA NPs.
Notes: (A) Size and (B) zeta potential of unloaded PLGA NPs. (C) Size and (D) zeta potential of shikonin-loaded PLGA NPs. Red arrow represents diameter Z-average.
Abbreviations: NPs, nanoparticles; PLGA, poly(lactic-co-glycolic acid).
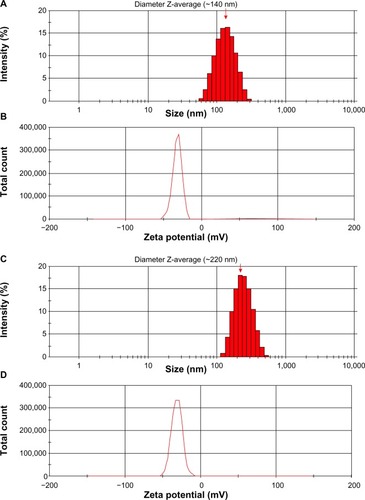
Figure 3 TEM and SEM micrographs of the shikonin-loaded PLGA NPs.
Notes: (A) TEM image of PLGA NPs. (B) Maximized TEM image of a single PLGA NP. (C) Maximized SEM image of a single PLGA NP.
Abbreviations: NP, nanoparticle; PLGA, poly(lactic-co-glycolic acid); SEM, scanning electron microscopy; TEM, transmission electron microscopy.
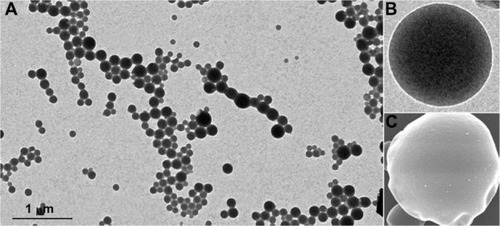
Figure 4 The release profile of shikonin from poly(lactic-co-glycolic acid) nanoparticles.
Note: The inset shows the release data fit with the Wagner log-probability.
Abbreviation: Ln t, natural logarithm of time.
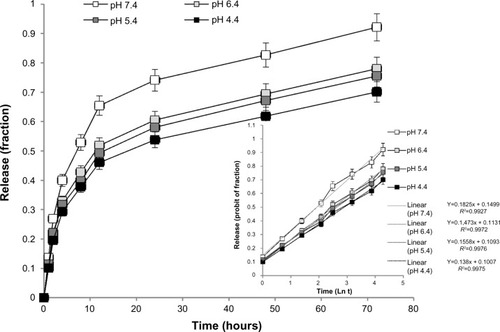
Figure 5 Fluorescence and transmission light microscopy of anti-TEM1 Ab-/scFv-armed fluorescein- and shikonin-loaded PLGA NPs in endothelial MS1 cells.
Notes: (A) Untreated TEM1-negative MS1 cells. (B) Anti-TEM1 Ab-armed NPs treated TEM1-negative MS1 cells. (C) Anti-TEM1 scFv-armed NPs treated TEM1-negative MS1 cells. (D) Untreated TEM1-positive MS1 cells. (E) Anti-TEM1 Ab-armed NPs treated TEM1-positive MS1 cells. (F) Anti-TEM1 scFv-armed NPs treated TEM1-positive MS1 cells. Green color represents fluorescein-loaded PLGA NPs. (G–I), respectively, represent light microscopy, fluorescence microscopy, and light microscopy–fluorescence microscopy superimposed images of anti-TEM1 scFv-armed NPs treated TEM1-positive MS1 cells. Phalloidin–tetramethylrhodamine B isothiocyanate was used to stain the cytoplasmic F-actin (red). 4′,6-diamidino-2-phenylindole was used to stain the nucleus (blue).
Abbreviations: Ab, antibody; NPs, nanoparticles; PLGA, poly(lactic-co-glycolic acid); scFv, single-chain variable fragment; TEM1, tumor endothelial marker 1.
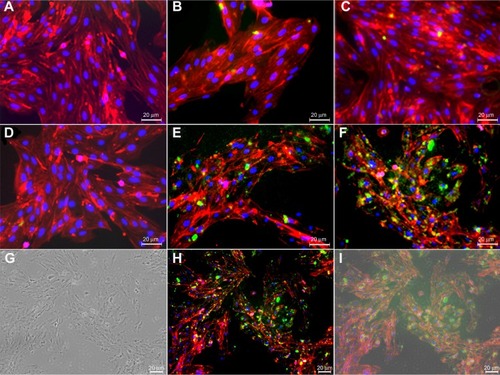
Figure 6 Fluorescence microscopy (FM) images of free shikonin (SHK) effects in OVCAR-5 cells.
Notes: (A) FM image of the untreated cells. (B) Stylized image of the untreated cells. (C) FM image of the treated cells with 5.0 μM SHK. (D) Stylized image of the treated cells with 10.0 μM SHK. (E) FM image of the treated cells with 20 μM SHK. (F) Stylized image of the treated cells with 20.0 μM SHK.
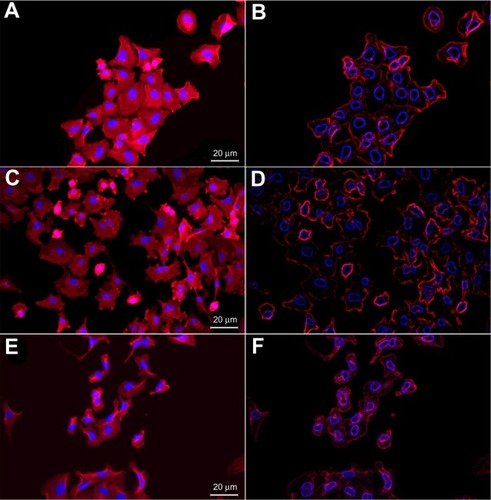
Figure 7 Effect of SHK on migration of ovarian cancer OVCAR-5 cells.
Notes: Cells were scratched and imaged at time 0 (A) and 6 hours post-scratching (B–E). (B) Untreated control cells. (C) Cells treated with 0.5 μM SHK. (D) Cells treated with 2.5 μM SHK. (E) Cells treated with 5.0 μM SHK. (F) Cell migration analysis of treated cells in comparison with the scratched cells at time 0.
Abbreviations: SHK, shikonin; UT, untreated.
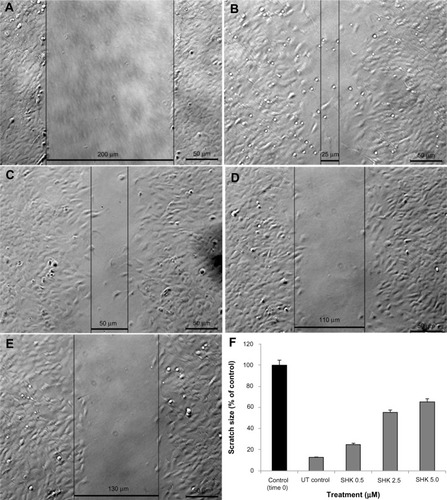
Figure 8 Cytotoxic effects of SHK.
Notes: (A) Free SHK-treated ovarian normal cells. (B) Free SHK-treated Jurkat cells. (C) Free SHK-treated ovarian cancer ID8 cells. (D) Free SHK-treated ovarian cancer OVCAR-5 cells. DOX was used as positive control. An asterisk represents statistical significance (P<0.05).
Abbreviations: DOX, doxorubicin; SHK, shikonin; UT, untreated.
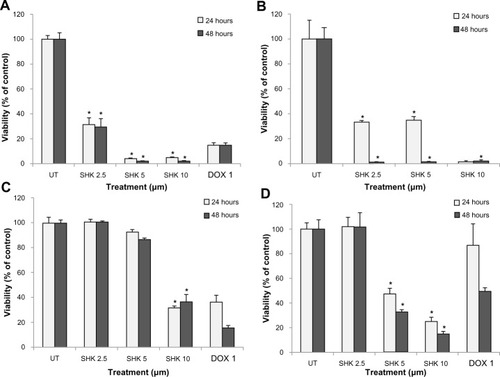
Figure 9 The cytotoxic effects of free SHK, free PLGA NPs, SHK-loaded PLGA NPs, and SHK-loaded PEGylated PLGA NPs in primary T-cells.
Notes: T-cells were exposed to SHK for 2 hours and then sulforhodamine B cytoto xicity assay was conducted. *Statistical significance (P<0.05).
Abbreviations: NPs, nanoparticles; PLGA, poly(lactic-co-glycolic acid); SHK, shikonin; PEG, polyethylene glycol.
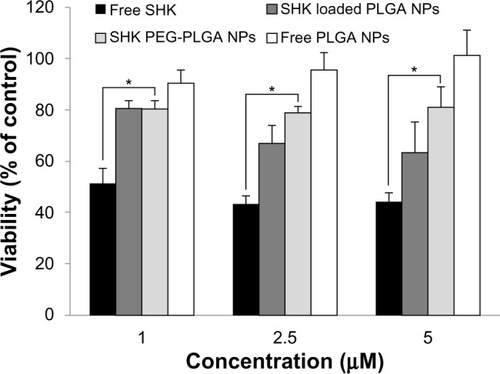
Figure 10 The cytotoxicity of anti-TEM1 Ab-/scFv-armed PEGylated PLGA NPs loaded with SHK in TEM1-positive and -negative MS1 endothelial cells.
Notes: The cultured cells were exposed to treatments for 2 hours and then subjected to either SRB cytotoxicity assay (A and B) or flow cytometry apoptosis/necrosis analysis (C–F). The SRB cytotoxicity assay was performed after 24 hours in cells treated with NPs containing SHK 2.5 μM (A) or 5.0 μM (B). The flow cytometry apoptosis/necrosis analysis was conducted after 6 hours. (C) Untreated control cells. (D) Free SHK-treated cells. (E) SHK-loaded Ab-armed PEGylated PLGA NP-treated cells. (F) SHK-loaded scFv-armed PEGylated PLGA NP-treated cells. The concentration of SHK was set at 5 μM in all treatments. *Statistical significance (P<0.05).
Abbreviations: Ab, antibody; NPs, nanoparticles; PEG, polyethylene glycol; PLGA, poly(lactic-co-glycolic acid); scFv, single-chain variable fragment; SHK, shikonin; SRB, sulforhodamine B; TEM1, tumor endothelial marker 1; UT, untreated.
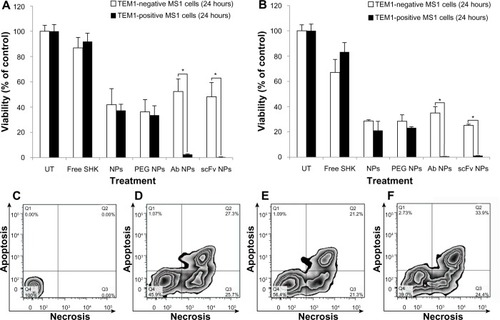
Figure 11 The cytotoxic effects of free SHK or SHK-loaded NPs in ovarian cancer OVCAR-5 cells.
Notes: Cells were treated with free SHK or SHK-loaded NPs. Cytotoxicity analyses were conducted 24 (A) and 48 (B) hours post-treatment.
Abbreviations: NPs, nanoparticles; PLGA, poly(lactic-co-glycolic acid); SHK, shikonin.
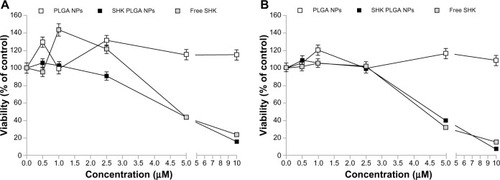
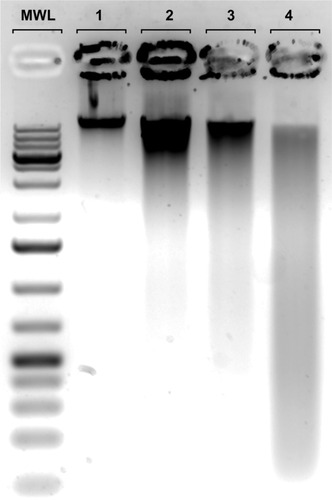
Figure 12 Effect of shikonin on DNA defragmentation in OVCAR-5 cells.
Notes: Lanes 1–4 represent untreated control cells and shikonin (2.5, 5.0, and 10.0 μM)-treated cells, respectively.
Abbreviation: MWL, molecular weight ladder.