Figures & data
Figure 1 Parameters affecting staurosporine encapsulation in liposomes – the importance of a reverse pH gradient, buffer composition, and drug-to-lipid ratio. Each experiment for all four panels was repeated three times. (A) Encapsulation of staurosporine in liposomes driven by different internal buffers (n=3). (B) Effect of internal buffer pH on staurosporine encapsulation. The external buffer was held at constant pH 3. (C) Effect of external buffer and its pH. The internal buffer was held at constant pH 7.4. (D) Encapsulation efficiencies of liposomal staurosporine at increasing initial drug-to-lipid ratios (mole/mole). Each data point represents mean encapsulation efficiency calculated from three samples.
Abbreviations: PBS, phosphate-buffered saline; HEPES, 4-(2-hydroxyethyl)-1-piperazineethanesul fonic acid.
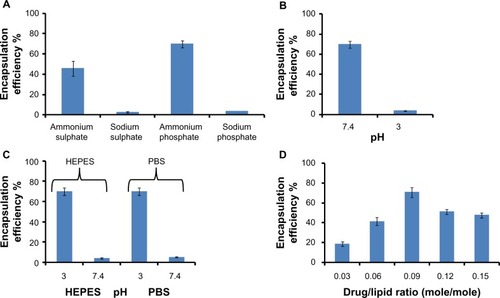
Figure 2 Gradient-loaded liposomes are stable with good payload retention in vitro. Liposomes suspended in (A) PBS and (B) human serum. Graphs show results of duplicate tests. Retention was measured after incubation in PBS/serum at room temperature for a range of times. Virtually 100% staurosporine was contained within the liposomes by 3 hours of incubation in PBS or serum, with approximately 80% of the staurosporine remaining after 6 hours of incubation. Red = expt 1; blue = expt 2.
Abbreviation: PBS, phosphate-buffered saline; expt, experiment.
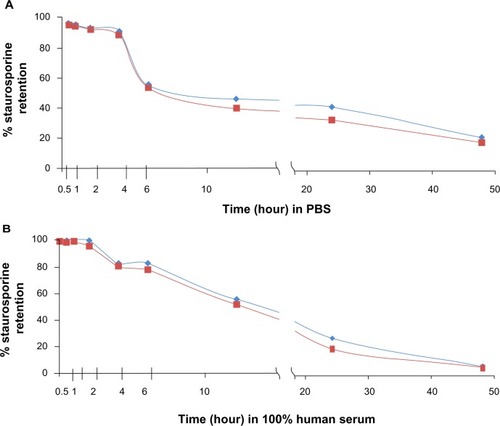
Figure 3 Potency and mechanism of liposomal staurosporine in vitro. (A) In vitro MTT cell viability assay results for free and liposomal staurosporine versus empty liposomes (control) were determined with U87 glioblastoma cells. First, 2,000 cells were plated and after 18 hours free or liposomal staurosporine was added. The concentration of free or liposomal staurosporine added to cultures ranged between 200 nm and 0.1 nm, with two-fold decrements down the range. Free and liposomal staurosporine had very similar potency while empty liposomes caused essentially no tumor cell killing. (B) Western blot analysis for Akt, P-Akt, and cleaved poly(ADP-ribose) polymerase. U87 cells were incubated with 200 nM, 10 nM, and 0.1 nM of staurosporine encapsulated in liposomes and staurosporine for 32 hours. (C) Bar graph showing caspase-3/7 activity as fold change from control (which is 1). Free and liposomal staurosporine yielded similar changes in caspase activity. (D) Fluorescence-activated cell sorting analysis for U87 glioblastoma cells incubated with either empty liposomes, 200 nM of staurosporine encapsulated in liposomes, dimethylsulfoxide, or free staurosporine. Representative plots of two repeats per condition are shown, and reveal that both free and liposomal staurosporine induced cell death, indicated by a G0/G1 shift, compared with the dimethylsulfoxide and empty liposome control treatments.
Abbreviations: conc, concentration; MTT, (3-(4,5-dimethylthiazol-2-yl)-2,5-diphenyltetrazolium bromide; Lipo, liposomal; PARP, poly(ADP-ribose) polymerase; GADPH, Glyceraldehyde 3-phosphate dehydrogenase; Akt, protein kinase B; DMSO, Dimethyl sulfoxide; Veh, DMSO vehicle control.
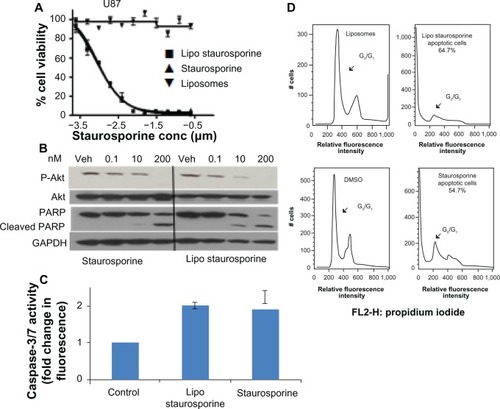
Figure 4 Liposomal BODIPY (boron-dipyrromethene) fluorescence attained a relatively high density in tumor tissue. (A) Liposomes (labeled red) clearly entered the tumor and accumulated at tumor microvessels (labeled green). (20 × scanning confocal image). (B) The bar graph shows the liposomal BODIPY pixel density for two mice bearing tumors that were injected intravenously with liposomes. Five images were acquired per organ in two mice, the pixel density was normalized by the total number of acquired pixels, and all organs were imaged with the same magnification. As expected, the spleen showed a high accumulation, but normal brain tissue showed very low accumulation. The filled columns indicate the average value while the superimposed line bars delineate the range.
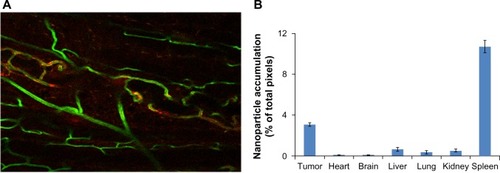
Figure 5 Liposomal staurosporine markedly suppressed 180–200 mm3 U87 flank tumors with no body weight-related evidence of toxicity. There were four subjects per group for tumor size, tumor images, body weight, and Ki-67. (A) Control (■), liposomal staurosporine (×) and free staurosporine (▲). The x-axis represents measurements (mean ± standard deviation) on successive days after tumor implantation (Parametric P<0.0004, shown in figure; nonparametric P=0.00018). (B) Tumor images for liposomal staurosporine, free staurosporine, and PBS groups. (C) Body weight bar graph showing a significant decline in body weight with free staurosporine, indicating toxicity (parametric P=0.0003, shown in figure; nonparametric P=0.005). Note for the liposomal staurosporine group that, at the end of the treatment period, body weight as compared with pretreatment weight did not differ from the same measure in controls. (D) Proliferating tumor cells identified using Ki-67 in PBS, staurosporine, and liposomal staurosporine treatment groups. The PBS and liposomal staurosporine groups differed significantly (Parametric, shown in the figure, and nonparametric P<0.03) while PBS versus free staurosporine did not. * indicates comparison between PBC and liposomal staurosporine.
Abbreviations: PBS, phosphate-buffered saline; lipo, liposomal.
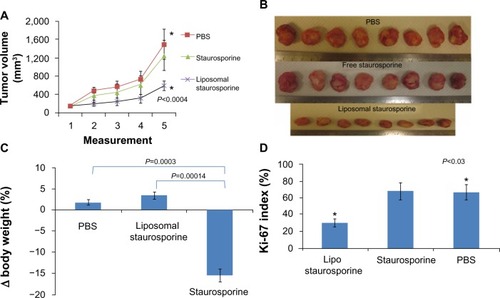
Figure 6 Liposomal staurosporine completely inhibited the growth of established 40–50 mm3 U87 flank tumors with no evidence of toxicity. PBS (♦), liposomes (■), liposomal staurosporine (▲). The x-axis represents measurements on successive days after tumor implantation (n=5; parametric P<0.0006 shown in figure; nonparametric P=0.00044). * indicates PBS versus liposomal staurosporine. (B) Photographs of nude mice implanted subcutaneously in both flanks with U87 cells and treated. (C) Body weights for mice treated with PBS, empty liposomes, or liposomal staurosporine. Unpaired, parametric and nonparametric comparisons indicated no significant difference between weights taken before versus after treatment (PBS versus liposomal staurosporine parametric P=0.096; empty liposomes versus liposomal staurosporine, parametric P=0.16).
Abbreviation: PBS, phosphate-buffered saline.
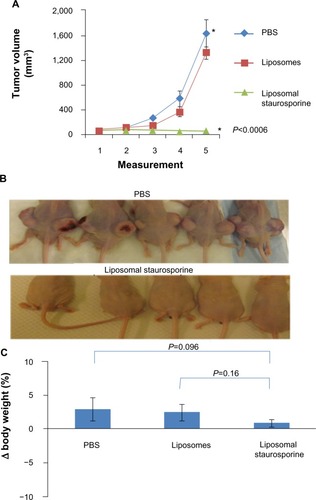
Figure S1 Characterization of staurosporine liposomes by DLS and SEM. (A) Size (diameter, nm) of staurosporine liposomes measured by differential light scattering (DLS). (B) Representative scanning transmission electron microscope (SEM) images showing the structure of staurosporine liposomes.
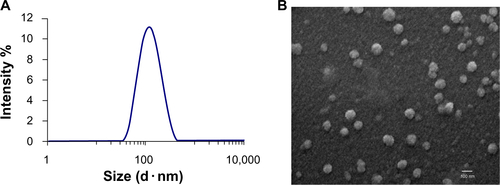
Figure S2 Graphs A–G depict staurosporine effects on viability (MTT assay) of the glioblastoma cell lines U118 (A), U251 (B), A172 (C), GBM4 (D), GBM8 (E) PC3 prostate tumor (F), and MDA-MB-231 breast tumor (G). Experiments were performed in triplicate and the mean ± standard error of the mean is indicated.
Abbreviations: conc, concentration; Lipo, liposomal; MTT, (3-(4,5-dimethylthiazol-2-yl)-2,5-diphenyltetrazolium bromide.
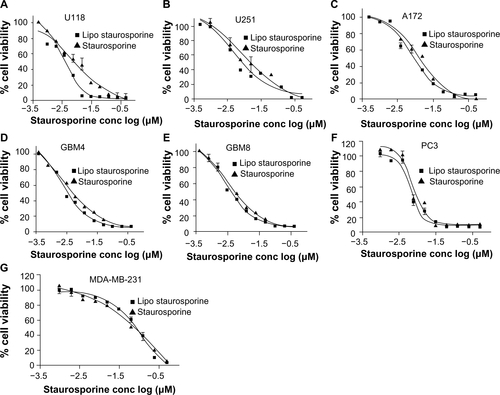
Figure S3 Liposomal uptake and morphological changes in U87 cells stably expressing GFP (green). Panel A is a brightfield image of the cells incubated with empty liposomes conjugated with fluorescent dye (BODIPY – red). Panel B shows these cells confocal imaged in the green channel (upper) and the red channel (lower). Panel C is a merge of green and red acquisitions and the arrows point to cells that clearly contain BODIPY labeled liposomes. Panel D is a brightfield image of U87 cells incubated with liposomes containing staurosporine. Note the rounded cells (arrows) which is consistent with apoptosis. Panel E shows the green and red channel acquisitions. Panel F is the merge. Note again the labeled liposomes are clearly inside the cells (arrows). In all images the white bars indicate 20 μM.
Abbreviations: GFP, green fluorescent protein; BODIPY, boron-dipyrromethene.
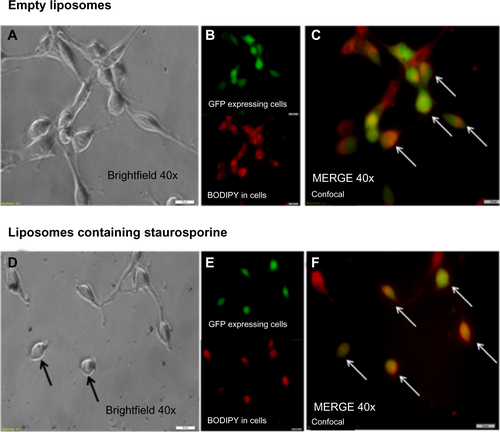
Table S1 The size and zeta potential of the staurosporine liposomal particles in PBS (saline) and water measured by laser light scattering using a Malvern Zetasizer (Malvern Instruments, Malvern, UK) as described in the text