Figures & data
Figure 1 The morphological characterization of non-eluting scaffolds (A) and MCP-1 drug-eluting scaffolds (B) by scanning electron microscope. The introduction of MCP-1 into the scaffold did not cause a morphological change of electrospun fibers.
Abbreviation: MCP-1, monocyte chemoattractant protein-1.
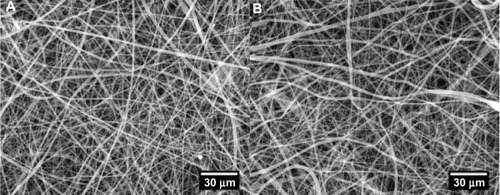
Figure 2 (A) The in vitro cumulative release of MCP-1 from DES. (B) The bioactivity of released MCP-1. The DES saw a rapid unleash of MCP-1 in the first week and then a steadfast release through week 3. No MCP-1 was detected in the NES group. MCP-1 retained its bioactivity throughout the delivery.
Notes: Negative = cell medium without MCP-1; positive = cell medium with MCP-1 (2 μg/mL); sample = supernatant containing released MCP-1 at week 3 (n=3).
Abbreviations: DES, drug-eluting scaffold; MCP-1, monocyte chemoattractant protein-1; NES, non-eluting scaffold; ns, not significant.
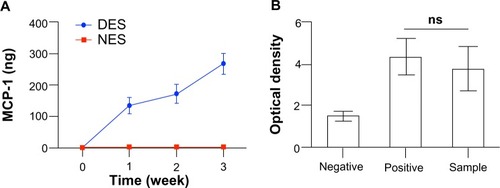
Figure 3 (A) The quantification of bioluminescent signals. (B) Representative bioluminescent images. The islet population in the DES group outgrew its peer in the NES group at week 4. This proliferative advantage was further pronounced at week 8.
Note: *Statistical difference between the groups (n=7 in the DES group; n=6 in the NES group).
Abbreviations: DES, drug-eluting scaffold; NES, non-eluting scaffold.
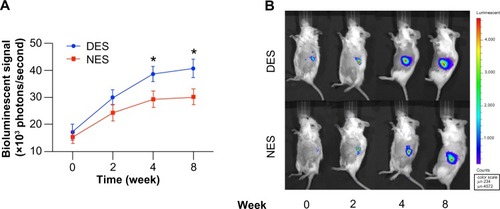
Figure 4 Functional outputs of transplanted islets: (A) blood insulin concentrations; and (B) C-peptide 2 concentrations. The insulin level in the DES group outperformed the NES group as early as week 2 and maintained this advantage through week 8. A correlated advantage of C-peptide 2 was observed.
Note: *Statistical difference between the groups (n=7 in the DES group; n=6 in the NES group).
Abbreviations: DES, drug-eluting scaffold; NES, non-eluting scaffold.
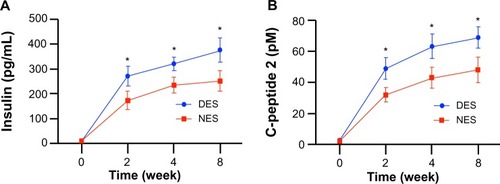
Figure 5 Blood glucose concentrations after the islet transplantation: blood glucose levels (A) and oral glucose tolerance test (B) at week 8. The blood glucose in the DES group returned to the physiological range as early as week 2, outpacing its peer from the NES group. Correspondingly, islet transplants in the DES group unleashed a greater resistance to sudden glucose challenge, evidencing the improved therapeutic effect of DESs.
Note: *Statistical difference between the groups (n=7 in the DES group; n=6 in the NES group).
Abbreviations: DES, drug-eluting scaffold; NES, non-eluting scaffold.
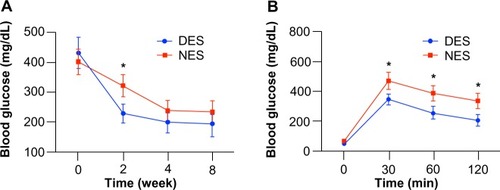
Figure 6 Creatinine levels in blood (A) and urine (B). The concentrations of blood creatinine and urine creatinine in the DES group fell to the physiological range by week 2, while those from the NES group were still abnormally high.
Note: *Statistical difference between the groups (n=7 in the DES group; n=6 in the NES group).
Abbreviations: DES, drug-eluting scaffold; NES, non-eluting scaffold.
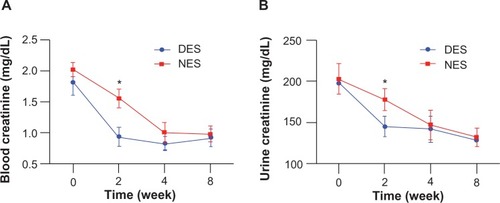
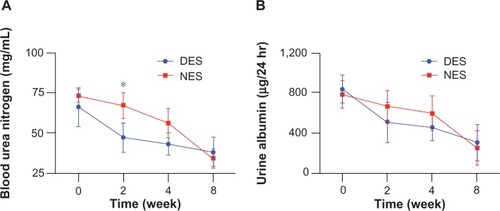
Figure 7 Blood urea nitrogen (A) and urine albumin (B) levels. The concentration of blood urea nitrogen in the DES group was reduced to the physiological range by week 2, while no difference of urine albumin concentrations between DES and NES groups was observed.
Note: *Statistical difference between the groups (n=7 in the DES group; n=6 in the NES group).
Abbreviations: DES, drug-eluting scaffold; NES, non-eluting scaffold.