Figures & data
Figure 1 (A) Molecular structures of Nap-GFFYG-RGD and Nap-GFFYG-RGE. (B) Schematic illustration for formation of Nap-GFFYG-RGD peptide nanofibers and encapsulation of curcumin.
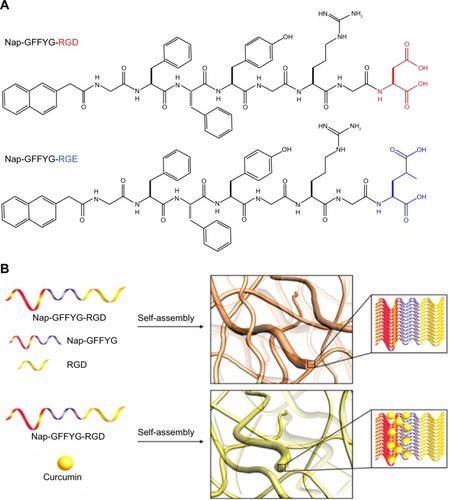
Figure 2 Transmission electron microscopic images of peptide nanofibers. (A) f-RGD, (B) f-RGE, and curcumin-encapsulated nanofibers (C) f-RGD-Cur and (D) f-RGD-Cur. Scale bar, 200 nm. The peptides could self-assemble into nanofibers (approximately 10–20 nm in width). Curcumin could be encapsulated into the nanofibers without any obvious effects on the shape of the nanofibers.
Abbreviations: f-RGD-Cur, curcumin-encapsulated Nap-GFFYG-RGD peptide nanofiber; f-RGE-Cur, curcumin-encapsulated Nap-GFFYG-RGE peptide nanofiber.
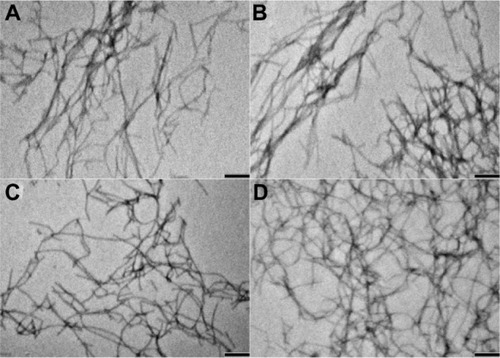
Figure 3 Encapsulation (A) and release profiles (B) of curcumin from f-RGD-Cur and f-RGE-Cur in release medium (0.5% Tween 80 in phosphate-buffered saline, pH 7.4) at 37°C. f-RGD-Cur and f-RGE-Cur had almost the same encapsulation efficiency and release properties. Both f-RGD-Cur and f-RGE-Cur showed a sustained drug release profile.
Abbreviations: f-RGD-Cur, curcumin-encapsulated Nap-GFFYG-RGD peptide nanofiber; f-RGE-Cur, curcumin-encapsulated Nap-GFFYG-RGE peptide nanofiber; h, hour.
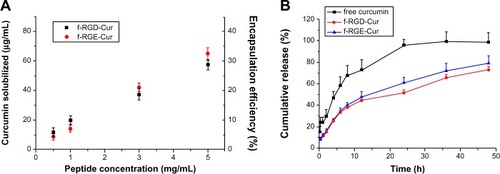
Figure 4 Uptake of various curcumin formulations by 293T (A–C), MCF-7 (D–F), and HepG2 (G–I) cells. The cells were incubated with free curcumin, f-RGD-Cur, or f-RGE-Cur at an equivalent curcumin concentration of 10 μg/mL for 4 hours. Scale bar, 30 µm. Uptake of f-RGD-Cur was greater by HepG2 cells overexpressing integrin αvβ3 than by αvβ3-negtive MCF-7 cells and 293T cells.
Abbreviations: f-RGD-Cur, curcumin-encapsulated Nap-GFFYG-RGD peptide nanofiber; f-RGE-Cur, curcumin-encapsulated Nap-GFFYG-RGE peptide nanofiber.
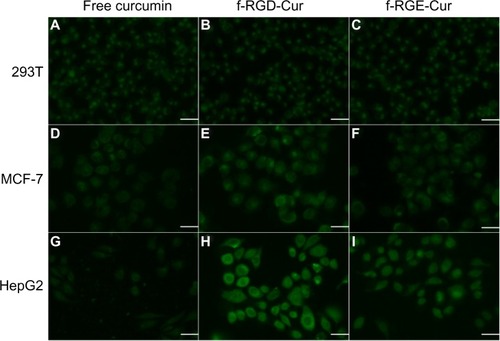
Figure 5 In vitro cytotoxicity of free curcumin, p-RGD, p-RGE, f-RGD-Cur, and f-RGE-Cur in NIH3T3 cells (A and B) and HepG2 cells (C and D) at 24 hours. p-RGD and p-RGE showed slight cytotoxicity to normal and cancer cells (A and C); f-RGD-Cur and f-RGE-Cur showed almost the same cytotoxicity to normal NIH3T3 cells (B), while f-RGD-Cur showed significantly greater cytotoxicity than f-RGE-Cur to HepG2 cells.
Abbreviations: f-RGD-Cur, curcumin-encapsulated Nap-GFFYG-RGD peptide nanofiber; f-RGE-Cur, curcumin-encapsulated Nap-GFFYG-RGE peptide nanofiber.
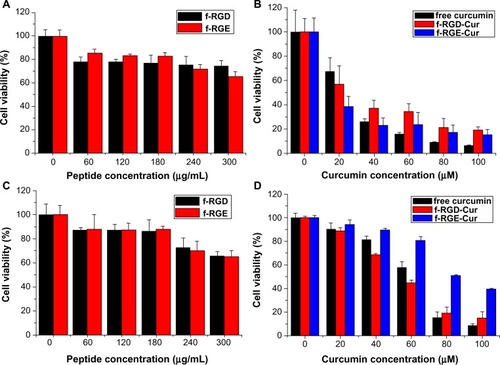
Figure 6 Ex vivo fluorescence images of tissues and tumors. Tissues were isolated from animals treated with 200 μL (10 μg/mL) of free curcumin or equivalent curcumin containing f-RGD-Cur or f-RGE-Cur4 hours after intravenous administration (n=5). (A) Representative images from one of the experiments for the organs. The fluorescence intensity reflects the concentration of curcumin. f-RGD-Cur showed the highest accumulation in tumors, followed by f-RGE-Cur, and free curcumin had the lowest distribution in tumors. (B) Relative fluorescence intensity of curcumin in the excised tumors. **P<0.01 for f-RGD-Cur compared with the free curcumin group, indicating a very significant difference in curcumin concentration between the two groups; *P<0.05 for f-RGD-Cur versus the f-RGE-Cur group, indicating a significant difference in curcumin concentration between the two groups.
Abbreviations: f-RGD-Cur, curcumin-encapsulated Nap-GFFYG-RGD peptide nanofiber; f-RGE-Cur, curcumin-encapsulated Nap-GFFYG-RGE peptide nanofiber.
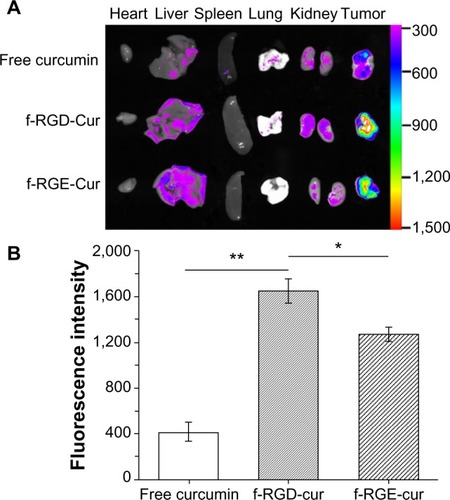
Figure S1 1H NMR spectrum of Nap-GFFYG-RGD.
Notes: Nap-GFFYG-RGD: 1H NMR (400 MHz, DMSO-d6) δ 8.20 (s, 3H); 8.02–8.05 (m, 5H); 7.80–7.84 (m, 3H); 7.74 (s, 1H); 7.40-7.47 (m, 4H); 7.15–7.21 (m, 11H); 7.04 (d, 2H); 6.64 (d, 2H); 4.40–4.49 (m, 4H); 4.30–4.35 (m, 1H); 3.69–3.78 (m, 6H); 3.59–3.66 (m, 4H); 3.08–3.10 (m, 2H); 2.90–2.99 (m, 3H); 2.56–2.75 (m, 6H); 2.33 (s, 1H); 1.72 (m, 1H); 1.50–1.53 (m, 3H). HR-MS: calc. M+ =1,085.4607, obsvd (M+H)+ =1,086.4686.
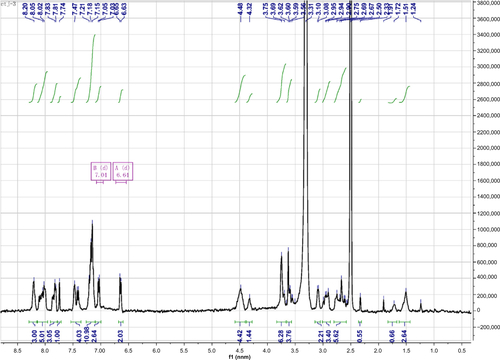
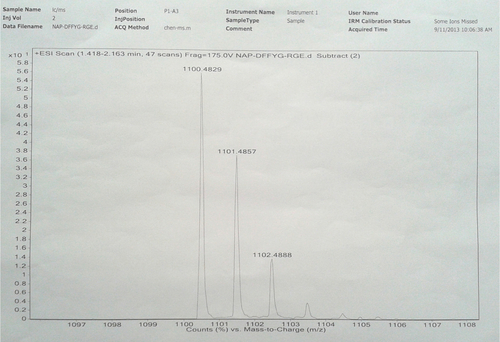
Figure S2 HR-MS of Nap-FFG.
Notes: Nap-GFFYG-RGE: 1H NMR (400 MHz, DMSO-d6) δ 8.22 (s, 3H); 8.02–8.09 (m, 6H); 7.83–7.85 (m, 3H); 7.74 (s, 1H); 7.40–7.47 (m, 4H); 7.15–7.18 (m, 11H); 7.03 (d, 2H); 6.65 (d, 2H); 4.35–4.50 (m, 4H); 4.25–4.32 (m, 4H); 3.70–3.76 (m, 7H); 3.58–3.62 (m, 8H); 3.09 (s, 3H); 2.90–2.94 (m, 4H); 2.65–2.78 (m, 5H); 2.30–2.35 (m, 3H); 1.40–1.52 (m, 3H); 1.243 (s, 1H). HR-MS: calc. M+ =1,099.4763, obsvd (M+H)+ =1,100.4829.
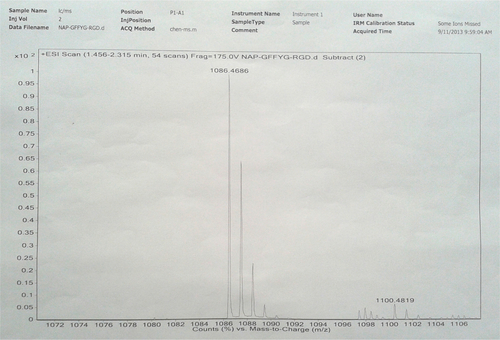
Figure S3 1H NMR spectrum of Nap-GFFYG-RGE.
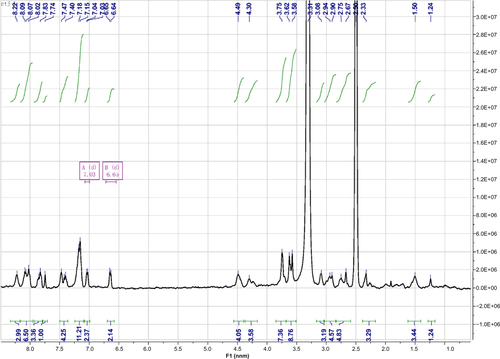
Figure S4 HR-MS of Nap-FFG.