Figures & data
Table 1 Characterization of the particle parameters of HANPs
Figure 1 Characterization of hydroxyapatite nanoparticles.
Notes: (A and B) Transmission electron microscopy image; inset: histogram showing size distribution; about 500 NPs were considered for the sample to obtain the size distribution histogram. (C) X-ray diffraction patterns. (D) Energy-dispersive X-ray spectroscopy spectra.
Abbreviations: CPS, counts per second; KCnt, 1,000 counts; NPs, nanoparticles.
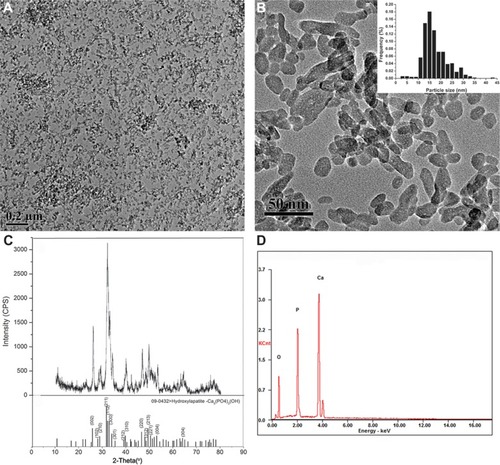
Figure 2 Cytotoxicity of hydroxyapatite nanoparticles to HUVEC and THP-1 cells.
Notes: Cells were exposed to increasing doses of hydroxyapatite nanoparticles for 24 hours, and cytotoxicity was determined by the MTS assay. Normal HUVECs or THP-1 cells without nanoparticle treatment served as control. Results are presented in mean ± standard error of the mean of the three independent experiments; each was carried out in triplicate. #P<0.05; **P<0.01 versus control; &P<0.05 significant difference between the compared groups.
Abbreviations: HUVECs, human umbilical vein endothelial cells; MTS, 3-(4, 5-dimethylthiazol-2-yl)-5-(3-carboxymethoxyphenyl)-2-(4-sulfophenyl)-2H-tetrazolium.
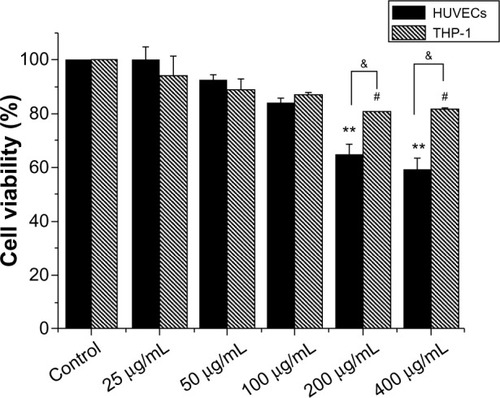
Figure 3 Uptake of HANPs by HUVEC and THP-1 cells.
Notes: TEM micrographs of cells exposed for 24 hours to HANPs. (A and B) HUVECs without any treatment; (C and D) HUVECs treated with HANPs; (E and F) THP-1 cells without any treatment; (G and H) THP-1 cells treated with HANPs. (A, C, E and G) Overall cell morphology (scale bar: 2 μm). (B, D, F and H) Higher magnification of cells in red boxed areas (scale bar: 1 μm). White arrows denote nanoparticles. Red arrows indicate the protrusion of the plasma membrane for phagocytosis.
Abbreviations: N, nucleus; HANPs, hydroxyapatite nanoparticles; HUVECs, human umbilical vein endothelial cells; TEM, transmission electron microscopy.
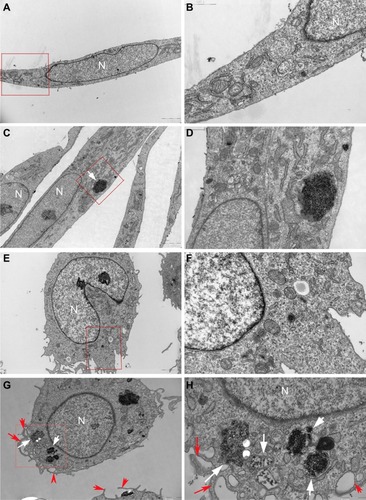
Figure 4 Proinflammatory cytokine production induced by HANPs in mono- and cocultures.
Notes: (A) TNF-α release; (B) IL-1β release; (C) IL-6 release; (D) IL-8 release. Normal HUVECs or THP-1 cells or cocultures without NPs treatment served as control. Results are presented as the mean ± standard error of the mean of three independent experiments, each of which was carried out in triplicate. *P<0.05; **P<0.01 versus control; &P<0.05 significant difference between compared groups.
Abbreviations: TNF-α, tumor necrosis factor-alpha; EC, endothelial cells; HANPs, hydroxyapatite nanoparticles; (HANPs+THP-1)s+EC, human umbilical vein endothelial cells treated with supernatants of hydroxyapatite nanoparticle-stimulated THP-1 cells; (HANPs+ECs)+THP-1, THP-1 cells treated with the supernatants of hydroxyapatite nanoparticle-stimulated human umbilical vein endothelial cells; IL, interleukin; NPs, nanoparticles.
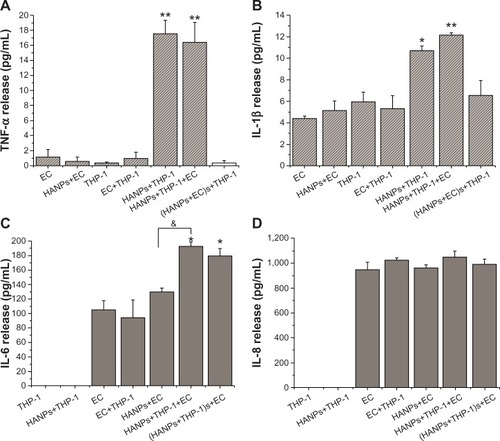
Figure 5 CAMs expression induced by HANPs in HUVECs in mono- and cocultures.
Notes: (A) Dot-plot of flow cytometry analysis showing the expressions of CD54, CD106, and CD62E on HUVECs in mono-and cocultures exposed to HANPs for 24 hours. (B) Bar graph shows the percentage of CD54-, CD106-, and CD62E-positive cells in NP-stimulated HUVECs in monoculture or in coculture. (C) The vWF expression on HUVECs in HANP-stimulated cocultures. Normal HUVECs served as the negative control. Data represent the means ± standard error of the means; n=3. *P<0.05; **P<0.01 versus control; ^P<0.05 versus HUVECs with HANPs.
Abbreviations: CD, cluster of differentiation; EC, endothelial cells; FITC, fluorescein isothiocyanate isomer 1; HANPs, hydroxyapatite nanoparticles; vWF, von Willebrand factor; CAMs, cell adhesion molecules; HUVECs, human umbilical vein endothelial cells; NP, nanoparticle; n, number.
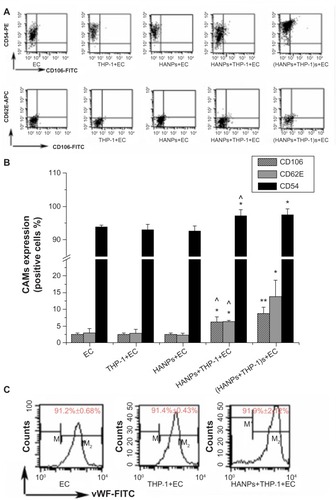
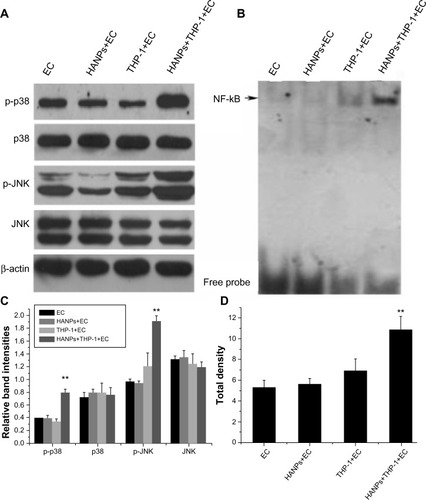
Figure 6 The activation of JNK, p38, and NF-κB by HANPs in HUVECs in mono- and cocultures.
Notes: (A) The activation of JNK and p38 by HANPs in HUVECs in mono- and cocultures. Aliquots of cell lysates were separated by SDS-PAGE and analyzed for protein expression by Western blotting, as described in section 2. β-actin was used as an internal control to monitor for equal loading. (B) The activation of NF-κB by HANPs in HUVECs in mono- and cocultures. (C) The relative density of the bands normalized to beta-actin by gray value analysis (β-actin as control); (D) The total density of the NF-κB band by gray value analysis. NF-κB DNA-binding activity was assayed by electrophoretic mobility shift assay as described in the Materials and methods section. **Represents a statistically significant difference from EC (P<0.01).
Abbreviations: JNK, c-Jun N-terminal kinase; EC, endothelial cells; HANPs, hydroxyapatite nanoparticles; NF-κB, nuclear factor-kappa B; HUVECs, human umbilical vein endothelial cells; SDS-Page, sodium dodecyl sulfate polyacrylamide gel electrophoresis.