Figures & data
Figure 1 (A and B) Evaluation of in vitro nanoparticle uptake. (A) Prussian blue staining of Balb/3T3 cells treated for 48 hours with the manganese ferrite nanofluid at the indicated concentrations. (B) Flow-cytometric analysis of dose- and time-dependent changes of side-scattered light in the nanofluid-exposed Balb/3T3 cells. Bar 20 μm.
Abbreviations: SSC, side scatter; FCM, flow cytometry; CN, untreated controls; NP, nanoparticle.
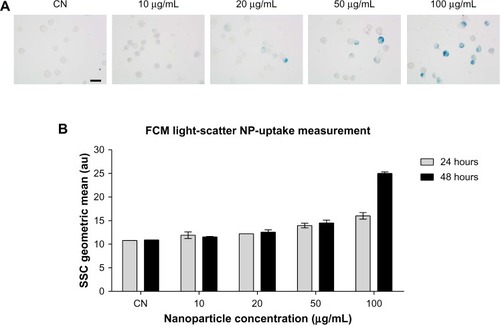
Figure 2 (A and B) Evaluation of in vitro cytotoxicity. (A) Results of the MTT assay: means ± SD of data normalized to untreated controls from eight measurements for each nanofluid concentration and 12 measurements for the untreated (CN) and H2O2-treated controls are shown. (B) Results of the colony-forming assay: mean ± SD of data normalized to untreated controls from three independent experiments in triplicate are shown.
Note: *P<0.05 with respect to untreated controls.
Abbreviations: MTT, 3-(4,5-dimethylthiazol-2-yl)-2,5-diphenyltetrazolium bromide; SD, standard deviation.
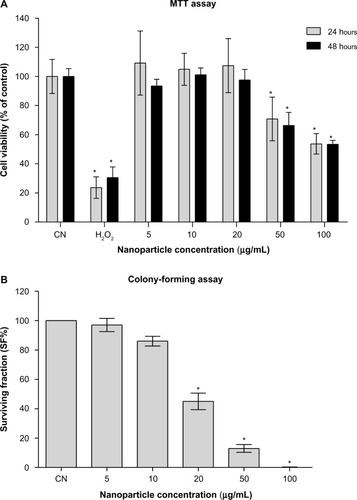
Figure 3 (A–D) Quantitative determination of nanoparticles in the liver and histological evaluation. (A) Changes in Mn levels at 6 hours, 24 hours, 7 days, and 21 days after intravenous injection. Data are presented as means ± standard error of mean (n=6). (B) Representative images of liver sections stained with Prussian blue to detect iron deposits (arrows and arrowhead) in the tissue at each time point; bar 10 μm. (C) Images of liver sections stained with hematoxylin and eosin showing normal tissue architecture; bar 50 μm. (D) High magnification (bar 10 μm) of liver region around the central vein (indicated with the dashed box in (C) at each time point reveals hydropic swelling of hepatocytes, particularly at 6 hours after nanoparticle injection. This cellular phenomenon is completely reversible, as confirmed by the normal appearance of hepatocytes at longer experimental times.
Abbreviation: CN, vehicle-treated mice.
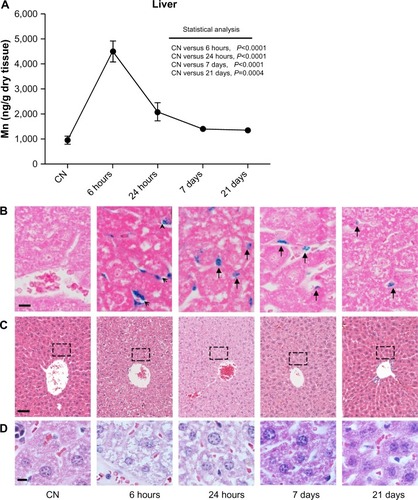
Figure 4 (A–C) Quantitative determination of nanoparticles in the kidney and histological evaluation. (A) Time-dependent changes in Mn concentrations in kidney after the ferrofluid intravenous injection. Data are presented as means ± standard error of mean (n=6). (B) Prussian blue staining of kidney sections shows the presence of iron (arrow and arrowhead) exclusively at shorter experimental times. Translocation of iron from cortical (6 hours) to medullary (24 hours) tubules suggests a rapid renal clearance of injected nanoparticles; bar 10 μm. (C) Images of kidney sections stained with hematoxylin and eosin showing no relevant change in cellular and tissue architecture; bar 50 μm.
Abbreviations: G, glomerulus; T, tubule; CN, vehicle-treated mice.
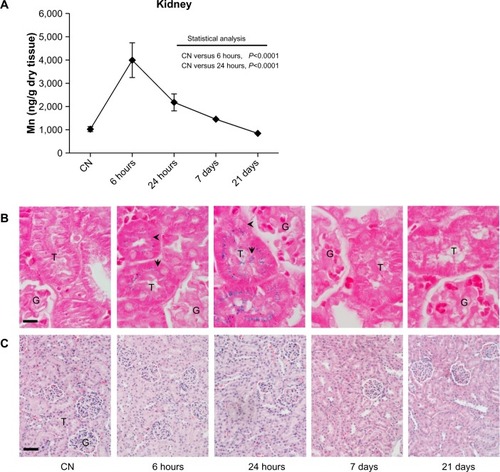
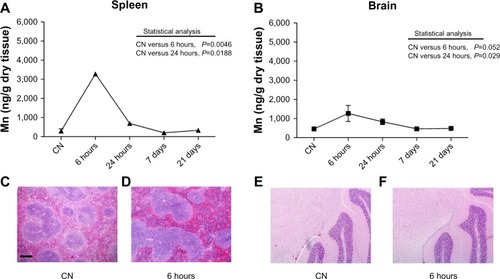
Figure 5 (A–F) Quantitative determination of nanoparticles in spleen and brain. Mn levels detected in (A) spleen and (B) brain. Data are presented as means ± standard error of mean (n=6). Images of spleen (C and D) and brain (E and F) sections stained with hematoxylin and eosin showing no histopathological change in the cellular and tissue architecture at 6 hours after nanoparticle injection compared to vehicle-treated mice (CN); bar 200 μm.