Figures & data
Figure 1 The effect of some process parameters on colloid and photophysical characteristics of nanoparticles.
Notes: (A) Hydrodynamic diameter and PDI of PVM/MA nanoparticles produced by solvent displacement in function of the initial PVM/MA concentration. (B) Efficiency of the AlPc association to PVM/MA nanoparticles in the function of the AlPc concentration in precipitation medium; (C) influence of Tween 20 and AlPc concentrations on the ΦF (excitation λ 350 nm, emission λ 690 nm) of AlPc nanoparticles dispersed in phosphate buffered saline, pH 7.2, at a concentration equivalent to 1 μM AlPc.
Abbreviations: PVM/MA, poly(methyl vinyl ether-co-maleic anhydride; AlPc, aluminum–phthalocyanine chloride; ΦF, fluorescence quantum yield; PDI, polydisperity index.
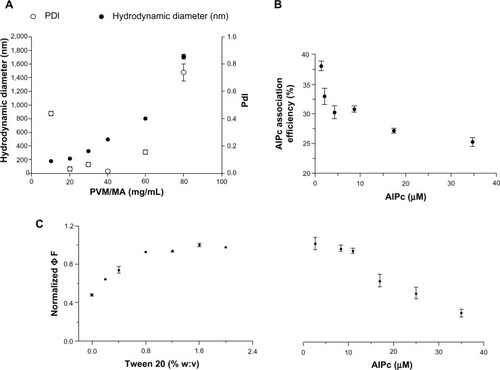
Figure 2 Characteristics of PVM/MA NPs with AlPc-NPs or without AlPc-NPs.
Notes: (A) Histogram showing the distribution of the AlPc-NPs’ hydrodynamic diameter values; (B) scanning electron microscopy image of AlPc-NPs; (C) colloidal characteristics of AlPc-NPs and NPs, fresh and after a single cycle of freezing/thawing. (B and C) Nanoparticles were suspended in phosphate buffered saline, pH 7.2.
Abbreviations: AlPc, aluminum–phthalocyanine chloride; NPs, nanoparticles; PVM/MA, poly(methyl vinyl ether-co-maleic anhydride); PDI, polydispersity index.
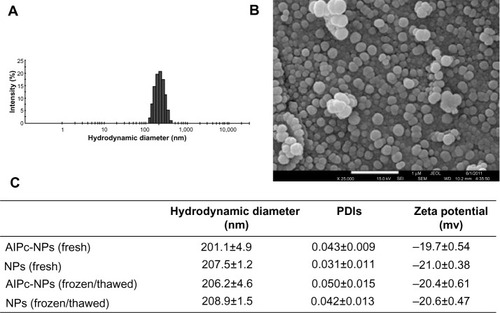
Figure 3 Absorbance and fluorescence (excitation at λ 350 nm) spectra of NPs and AlPc-NPs (1 μM AlPc) dispersed in PBS, before and after NP dissolution, and of 1 μM free AlPc in PBS or ethanol.
Abbreviations: OD, optical density; AlPc, aluminum–phthalocyanine chloride; PBS, phosphate buffered saline; NP, nanoparticle.
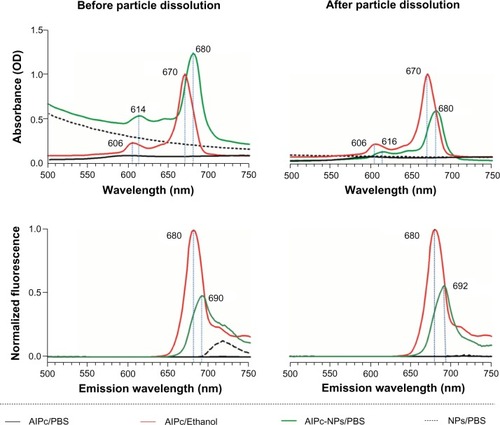
Figure 4 Variation of turbidity (absorbance at λ 510 nm) and fluorescence (excitation λ 350 nm, emmission λ 670 nm) with time for AlPc-NPs (1 μM AlPc) dispersed in PBS at 25°C.
Abbreviations: OD, optical density; AlPc, aluminum–phthalocyanine chloride; NPs, nanoparticles; PBS, phosphate buffered saline.
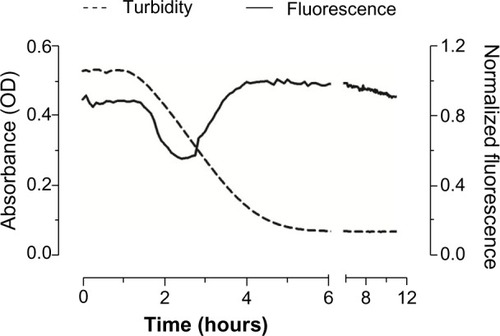
Figure 5 FTIR spectra of AlPc, PVM/MA, fresh AlPc-NPs, and AlPc-NPs exposed to water for 6 hours.
Notes: The appearance of carboxyl bands, at 1,362 cm−1 and 1,733 cm−1, and the decrease in the intensity of anhydride bands, at 1,770 cm−1 and 1,842 cm−1, shows that the anhydride groups of PVM/MA are hydrolyzed when AlPc-NPs are exposed to water.
Abbreviations: AlPc, aluminum–phthalocyanine chloride; NPs, nanoparticles; PVM/MA, poly(methyl vinyl ether-co-maleic anhydride); FTIR, Fourier transform infrared spectrophotometer.
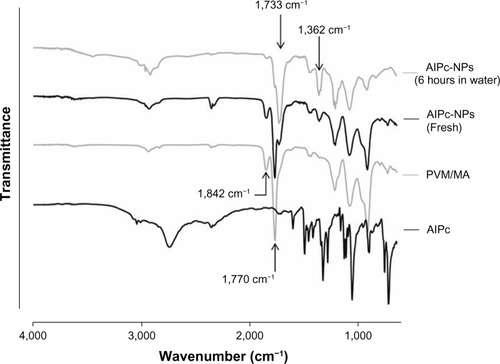
Figure 6 Generation of singlet oxygen by 1 μM free AlPc in ethanol or PBS, and by pure PVM/MA NPs, fresh AlPc-NPs (1 μM AlPc), and dissolved AlPc-NPs (1 µM AlPc) in PBS under irradiation with a laser (λ 670 nm, energy density of 0.5 J/cm2).
Note: aP<0.05 versus all the other groups.
Abbreviations: PBS, phosphate buffered saline; AlPc, aluminum–phthalocyanine chloride; NPs, nanoparticles; PVM/MA, poly(methyl vinyl ether-co-maleic anhydride).
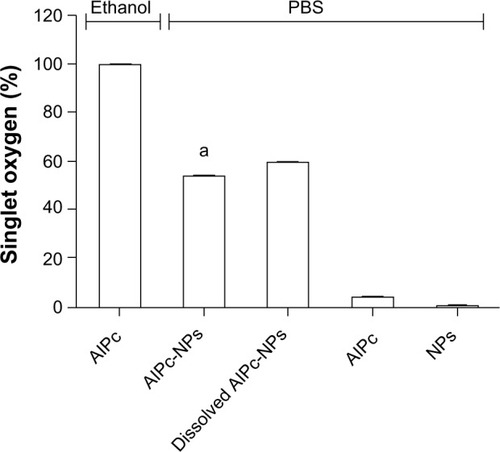
Figure 7 In vitro incorporation of AlPc-NPs by cancerous (4T1 [murine] and MCF-7 [human]) and noncancerous (NIH/3T3 [murine] and MCF-10A [human]) cells.
Notes: (A) Evolution of incorporation with time; aP<0.01 for 4T1 versus NIH/3T3, P<0.001 for MCF-7 versus MCF-10A; bP<0.001 for 4T1 versus NIH/3T3 and for MCF-7 versus MCF-10A. (B) Confocal images of cells exposed to AlPc associated to PVM/MA NPs (AlPc-NPs; concentration equivalent to 0.25 μM AlPc) for 15 minutes; AlPc appears in red; the scale bar (white rod) length is equal to 50 μm for 4T1, NIH/3T3, and MCF-10, and 10 μm for MCF-7.
Abbreviations: AlPc, aluminum–phthalocyanine chloride; NPs, nanoparticles; PVM/MA, poly(methyl vinyl ether-co-maleic anhydride).
![Figure 7 In vitro incorporation of AlPc-NPs by cancerous (4T1 [murine] and MCF-7 [human]) and noncancerous (NIH/3T3 [murine] and MCF-10A [human]) cells.Notes: (A) Evolution of incorporation with time; aP<0.01 for 4T1 versus NIH/3T3, P<0.001 for MCF-7 versus MCF-10A; bP<0.001 for 4T1 versus NIH/3T3 and for MCF-7 versus MCF-10A. (B) Confocal images of cells exposed to AlPc associated to PVM/MA NPs (AlPc-NPs; concentration equivalent to 0.25 μM AlPc) for 15 minutes; AlPc appears in red; the scale bar (white rod) length is equal to 50 μm for 4T1, NIH/3T3, and MCF-10, and 10 μm for MCF-7.Abbreviations: AlPc, aluminum–phthalocyanine chloride; NPs, nanoparticles; PVM/MA, poly(methyl vinyl ether-co-maleic anhydride).](/cms/asset/645d5807-5d70-455e-a585-a8ba70737246/dijn_a_57420_f0007_c.jpg)
Figure 8 Viability of cancerous (4T1 [murine] and MCF-7 [human]) and noncancerous (NIH/3T3 [murine] and MCF-10A [human]) cells after exposure to laser alone, PVM/MA NPs, and AlPc associated to PVM/MA NPs.
Notes: (A) Laser (670 nm) alone; (B) PVM/MA NPs in the dark; and (C and D) AlPc associated to PVM/MA NPs (AlPc-NPs) in the dark. (A and B) There were no statistically significant differences between the viabilities of treated and nontreated cells. aP<0.05 versus 0 μM; bP<0.001 versus 0 μM; cP<0.01 versus 0 μM.
Abbreviations: PVM/MA, poly(methyl vinyl ether-co-maleic anhydride); AlPc, aluminum–phthalocyanine chloride; NPs, nanoparticles.
![Figure 8 Viability of cancerous (4T1 [murine] and MCF-7 [human]) and noncancerous (NIH/3T3 [murine] and MCF-10A [human]) cells after exposure to laser alone, PVM/MA NPs, and AlPc associated to PVM/MA NPs.Notes: (A) Laser (670 nm) alone; (B) PVM/MA NPs in the dark; and (C and D) AlPc associated to PVM/MA NPs (AlPc-NPs) in the dark. (A and B) There were no statistically significant differences between the viabilities of treated and nontreated cells. aP<0.05 versus 0 μM; bP<0.001 versus 0 μM; cP<0.01 versus 0 μM.Abbreviations: PVM/MA, poly(methyl vinyl ether-co-maleic anhydride); AlPc, aluminum–phthalocyanine chloride; NPs, nanoparticles.](/cms/asset/502aa0d4-931e-475b-b7d7-4a456af964bf/dijn_a_57420_f0008_c.jpg)
Figure 9 Viability of cancerous (4T1 [murine] and MCF-7 [human]) and noncancerous (NIH/3T3 [murine] and MCF-10A [human]) cells after exposure to AlPc associated to poly(methyl vinyl ether-co-maleic anhydride) nanoparticles, at different concentrations of AlPc, for 15 minutes followed by the application of light (laser, 670 nm) at different energy densities in vitro.
Note: Pairs of means in the same graph identified with different letters are statistically different (P<0.05).
Abbreviation: AlPc, aluminum–phthalocyanine chloride.
![Figure 9 Viability of cancerous (4T1 [murine] and MCF-7 [human]) and noncancerous (NIH/3T3 [murine] and MCF-10A [human]) cells after exposure to AlPc associated to poly(methyl vinyl ether-co-maleic anhydride) nanoparticles, at different concentrations of AlPc, for 15 minutes followed by the application of light (laser, 670 nm) at different energy densities in vitro.Note: Pairs of means in the same graph identified with different letters are statistically different (P<0.05).Abbreviation: AlPc, aluminum–phthalocyanine chloride.](/cms/asset/7010b64c-a916-40ef-adc7-78c7e31e756c/dijn_a_57420_f0009_c.jpg)
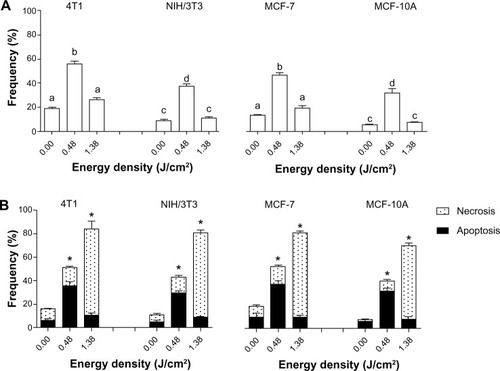
Figure 10 DNA fragmentation and cell death assessed after exposure of cells to LC at 10% (LC10) of AlPc-NPs for 15 minutes followed by the application of light (laser, λ 670 nm) at different energy densities in vitro.
Notes: (A) DNA fragmentation and (B) cell death. The values of LC50 for 4T1, NIH/3T3, MCF-7, and MCF-10A were 0.31 μM AlPc, 0.63 μM AlPc, 0.46 μM AlPc, and 1.80 μM AlPc, respectively. (A) The difference between pairs of means in the same graph identified with different letters are statistically significant (P<0.05). (B) *Groups presenting with a statistically significant difference between the means for apoptosis and necrosis; no statistically significant differences were observed between the results of different cell lineages of the same origin.
Abbreviations: NPs, nanoparticles; LC, lethal concentrations; AlPc, aluminum–phthalocyanine chloride.