Figures & data
Figure 1 Growth curves for (A) male and (B) female rats administered ZnOAE100(−) by gavage for 90 days.a
Notes: aZnOAE100(−) was orally administered to Sprague Dawley rats at doses of 31.25 mg/kg, 125 mg/kg, and 500 mg/kg for 90 days. The results are presented as mean ± standard deviation.
Abbreviations: G1, negative control; G2, vehicle control, G3, 31.25 mg/kg treatment group; G4, 125 mg/kg treatment group; G5, 500 mg/kg treatment group; ZnO, zinc oxide; ZnOAE100(−), 100 nm negatively charged ZnO.
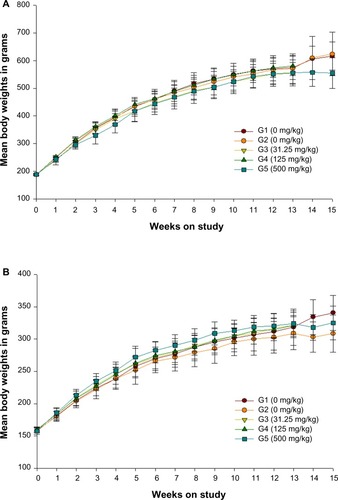
Figure 2 Growth curves for (A) male and (B) female rats administered ZnOAE100(+) by gavage for 90 days.a
Notes: aZnOAE100(+) was orally administered to Sprague Dawley rats at doses of 31.25 mg/kg, 125 mg/kg, and 500 mg/kg for 90 days. The results are presented as mean ± standard deviation.
Abbreviations: G1, negative control; G2, vehicle control, G3, 31.25 mg/kg treatment group; G4, 125 mg/kg treatment group; G5, 500 mg/kg treatment group; ZnO, zinc oxide; ZnOAE100(+), 100 nm positively charged ZnO.
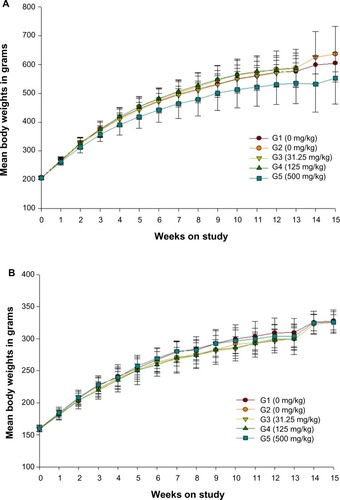
Table 1 Feed consumption for rats in the 90-day gavage study of negatively charged 100 nm zinc oxide nanoparticlesTable Footnote*
Table 2 Feed consumption for rats in the 90-day gavage study of positively charged 100 nm zinc oxide nanoparticlesTable Footnote*
Table 3 Water consumption for rats in the 90-day gavage study of negatively charged 100 nm zinc oxide nanoparticlesTable Footnote*
Table 4 Water consumption for rats in the 90-day gavage study of positively charged 100 nm zinc oxide nanoparticlesTable Footnote*
Table 5 Organ weight and organ-weight-to-body-weight ratios of main groups in the 90-day gavage study of 100 nm zinc oxide nanoparticlesTable Footnote*
Table 6 Organ weight and organ-weight-to-body-weight ratios of recovery groups in the 90-day gavage study of 100 nm positively charged zinc oxide nanoparticlesTable Footnote*
Table 7 Hematology data of main groups in the 90-day gavage study of 100 nm zinc oxide nanoparticlesTable Footnote*
Table 8 Hematology data of recovery groups in the 90-day gavage study of 100 nm zinc oxide nanoparticlesTable Footnote*
Table 9 Blood biochemistry data of main groups in the 90-day gavage study of 100 nm zinc oxide nanoparticlesTable Footnote*
Table 10 Blood biochemistry data of recovery groups in the 90-day gavage study of 100 nm zinc oxide nanoparticlesTable Footnote*
Figure 3 Histopathological changes in the stomach after treatment with ZnOAE100(−) at a dose of 500 mg/kg for 90 days. Stomach sections were stained with hematoxylin and eosin. (A) Control for limiting ridge. (C, E and G) Control for mucosa in glandular stomach. (B, D, F and H) 500 mg/kg treatment groups.a
Notes: aArrows in (B) represent squamous cell vacuolation, in (D) show eosinophilic chief cells, in (F) indicate acinar cell apoptosis, and in (H) represent intracytoplasmic hyaline droplets.
Abbreviations: H, squamous cell hyperplasia; N, normal mucosa; NE, normal epithelium; NS, normal submucosa; SI, submucosal edema and inflammatory cell infiltration; ZnO, zinc oxide, ZnOAE100(−), 100 nm negatively charged ZnO.
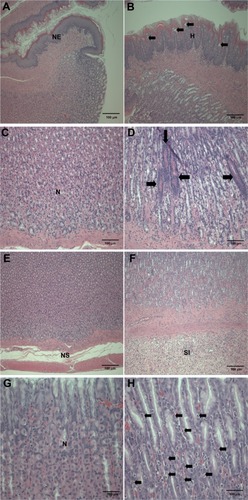
Figure 4 Histopathological changes in the stomach after treatment with ZnOAE100(+) at a dose of 500 mg/kg for 90 days. Stomach sections were stained with hematoxylin and eosin. (A) Control for limiting ridge. (C, E and G) Control for mucosa in glandular stomach. (B, D, F and H) 500 mg/kg treatment groups.a
Note: aArrows in (B) represent squamous cell vacuolation, in (D) show eosinophilic chief cells, in (F) indicate submucosal edema and inflammatory cell infiltration, and in (H) represent intracytoplasmic hyaline droplets.
Abbreviations: H, squamous cell hyperplasia; N, normal mucosa; NE, normal epithelium; NS, normal submucosa; ZnO, zinc oxide; ZnOAE100(+), 100 nm positively charged ZnO.
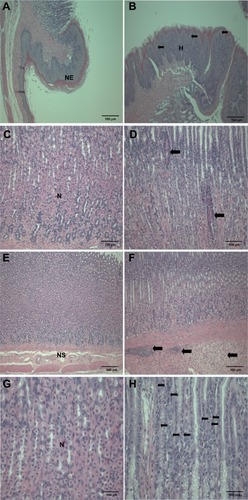
Figure 5 Histopathological changes in the pancreas after treatment with (A and B) ZnOAE100(−) and (C and D) ZnOAE100(+) at a dose of 500 mg/kg for 90 days. The pancreas sections were stained with hematoxylin and eosin. (A and C) Control for acinar cell. (B and D) 500 mg/kg treatment groups.a
Notes: aArrows in (B and D) represent acinar cell apoptosis in the pancreas.
Abbreviations: A, chronic inflammation; DH, ductular hyperplasia; IL, interstitial lymphoid cell infiltration; NA, normal acinar cell; P, prominent acinar cell; ZnO, zinc oxide; ZnOAE100(−), 100 nm negatively charged ZnO; ZnOAE100(+), 100 nm positively charged ZnO.
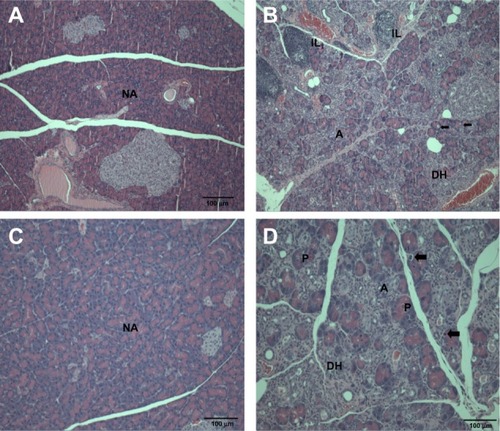
Figure 6 Histopathological changes in the prostate gland after treatment with (A and B) ZnOAE100(−) and (C and D) ZnOAE100(+) at a dose of 500 mg/kg for 90 days. Prostate gland sections were stained with hematoxylin and eosin. (A and C) Control for the prostate gland tubule. (B and D) 500 mg/kg treatment groups.a
Note: aArrows in (B and D) show tubular hyperplasia in the prostate gland.
Abbreviations: A, suppurative inflammation, N, normal tubule; ZnO, zinc oxide; ZnOAE100(−), 100 nm negatively charged ZnO; ZnOAE100(+), 100 nm positively charged ZnO.
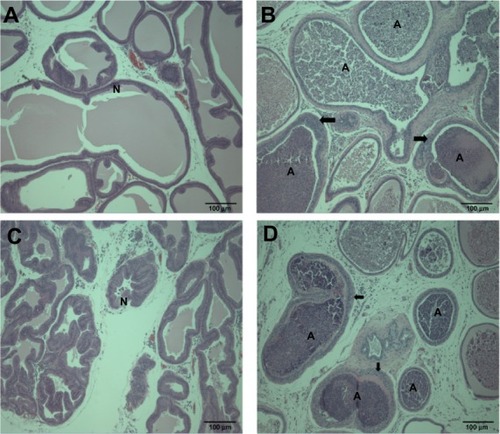
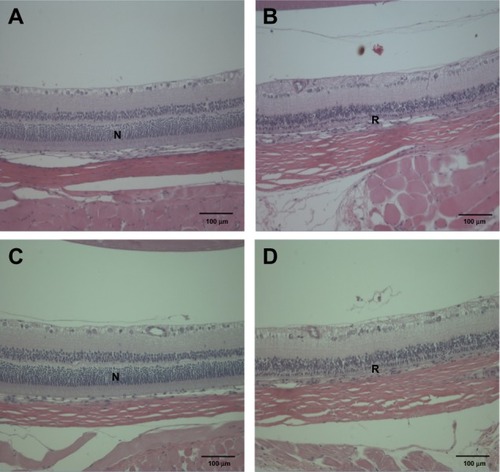
Figure 7 Histopathological changes in the eye after treatment with (A and B) ZnOAE100(−) and (C and D) ZnOAE100(+) at a dose of 500 mg/kg for 90 days. Eye sections were stained with hematoxylin and eosin. (A and C) Control for the eye. (B and D) 500 mg/kg treatment groups.
Abbreviations: N, normal eye; R, retinal atrophy; ZnO, zinc oxide; ZnOAE100(−), 100 nm negatively charged ZnO; ZnOAE100(+), 100 nm positively charged ZnO.