Figures & data
Figure 1 Ultraviolet-visible spectra of AH-AgNPs obtained via Agrimoniae herba extract and 1 mM AgNO3 for various extraction times.
Notes: The full line represents the optimum reaction time, and the dashed lines represent assayed reaction conditions. The ordinate represents the maximal ultraviolet absorption within a range of 300–800 nm.
Abbreviation: AH-AgNPs, Agrimoniae herba-conjugated Ag nanoparticles.
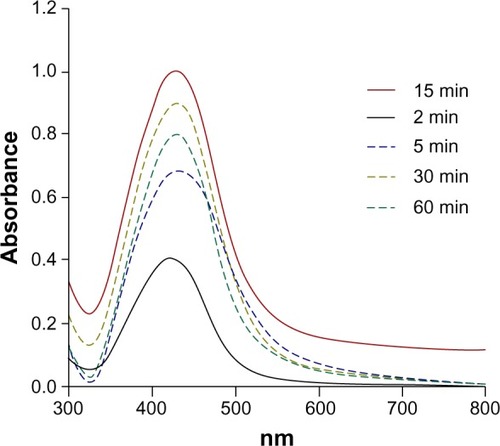
Figure 2 Time course of AH-AgNPs prepared via Agrimoniae herba extract and 1 mM AgNO3 under different reaction temperatures.
Notes: The full line represents the optimum reaction temperature, and the dashed lines represent assayed reaction temperatures. Data represent means ± standard deviation. The ordinate represents the maximal ultraviolet absorption within a range of 300–800 nm.
Abbreviation: AH-AgNPs, Agrimoniae herba-conjugated Ag nanoparticles.
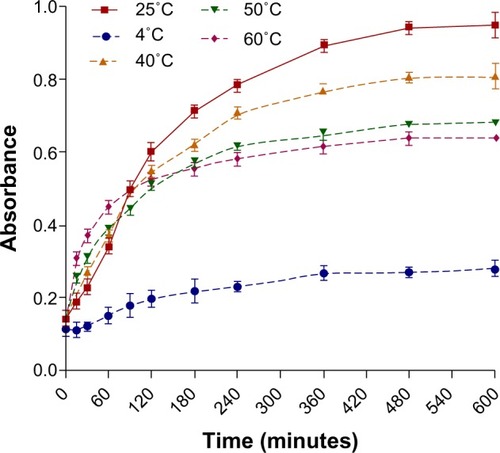
Figure 3 Ultraviolet-visible spectra of AH-AgNPs obtained via Agrimoniae herba extract at various concentrations of AgNO3.
Notes: The full line represents the optimum concentration of AgNO3, and the dashed lines represent assayed concentrations of AgNO3. The ordinate represents the maximal ultraviolet absorption within a range of 300–800 nm.
Abbreviation: AH-AgNPs, Agrimoniae herba-conjugated Ag nanoparticles.
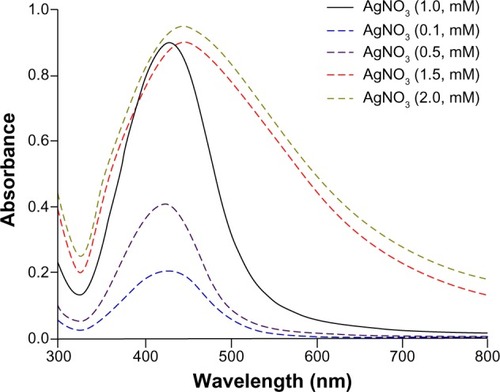
Figure 4 Ultraviolet-visible spectra of AH-AgNPs obtained at various volume ratios of Agrimoniae herba extract to AgNO3.
Notes: The full line represents the optimum amount of A. herba extract, and the dashed lines represent the assayed amount of A. herba extract. The ordinate represents the maximal ultraviolet absorption within a range of 300–800 nm.
Abbreviation: AH-AgNPs, Agrimoniae herba-conjugated Ag nanoparticles.
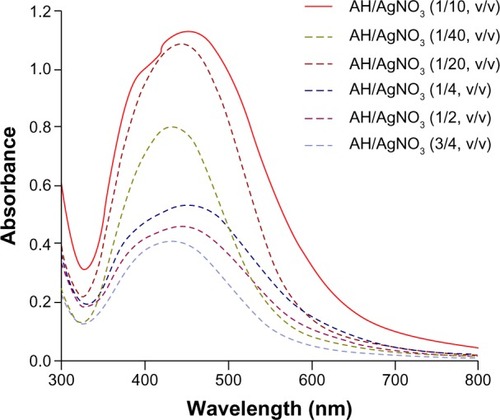
Figure 5 Evaluation of stability of Agrimoniae herba extract, AH-AgNPs, and AH-AgNPs 2 months later by using an ultraviolet-visible instrument.
Abbreviation: AH-AgNPs, Agrimoniae herba-conjugated Ag nanoparticles.
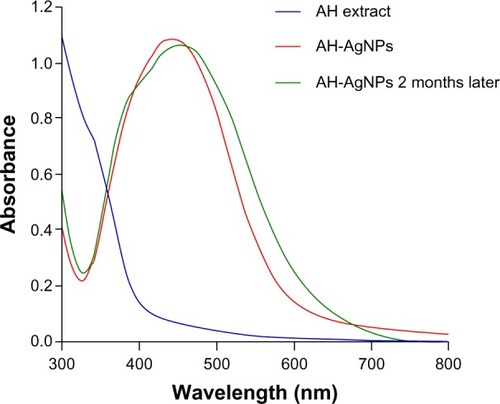
Figure 6 (A and B) Morphologic characteristics. (A) TEM image and (B) particle-size distribution of AH-AgNPs synthesized via Agrimoniae herba extract and AgNO3.
Abbreviations: TEM, transmission electron microscopy; AH-AgNPs, Agrimoniae herba-conjugated Ag nanoparticles.
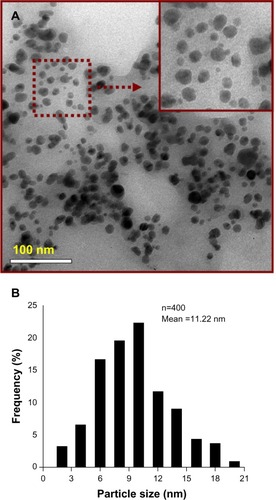
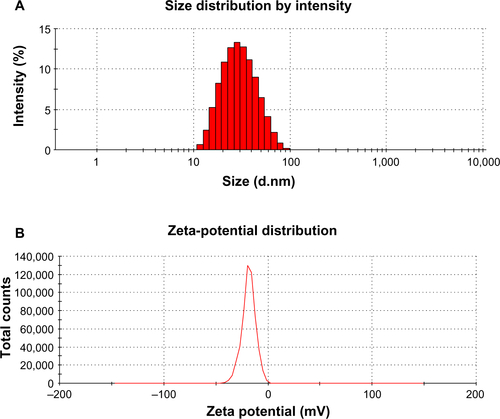
Figure 7 (A and B) Structure characteristics by DLS patterns. (A) Size distribution of AH-AgNPs; (B) zeta-potential analysis of AH-AgNPs.
Abbreviations: DLS, dynamic light scattering; AH-AgNPs, Agrimoniae herba-conjugated Ag nanoparticles.
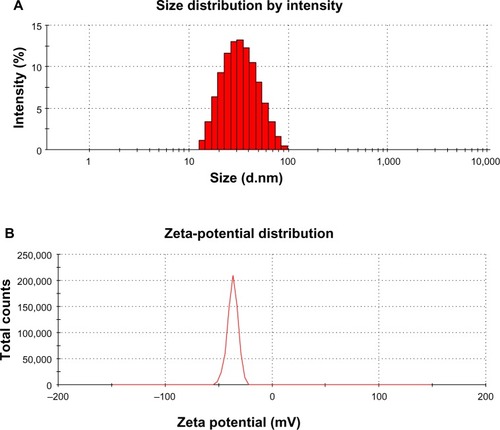
Figure 8 X-ray diffraction patterns of AH-AgNPs.
Abbreviation: AH-AgNPs, Agrimoniae herba-conjugated Ag nanoparticles.
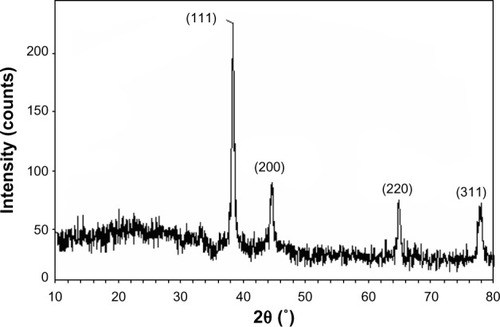
Table 1 X-ray diffraction measurement of AH-AgNPs for evaluating the average crystallite size
Figure 9 Fourier-transform infrared absorption spectra of Agrimoniae herba extract (A), and (B) AH-AgNP freeze-dried power.
Abbreviation: AH-AgNPs, Agrimoniae herba-conjugated Ag nanoparticles.
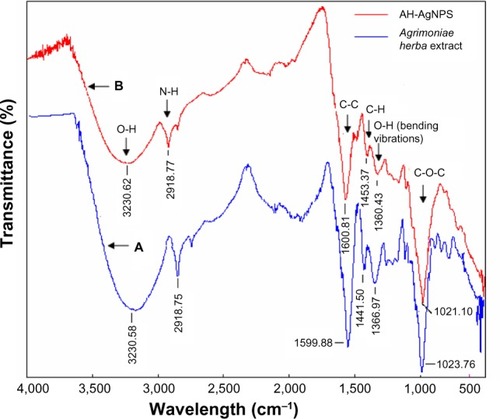
Figure 10 Cytotoxicity of (A) AH-AgNPs and bare-AgNPs, and (B) Agrimoniae Herba extract against A549 cells.
Notes: **P<0.01 versus bare AgNPs. Data represent means ± standard deviation.
Abbreviations: AH-AgNPs, Agrimoniae herba-conjugated Ag nanoparticles; IC50, half-maximal inhibitory concentration.
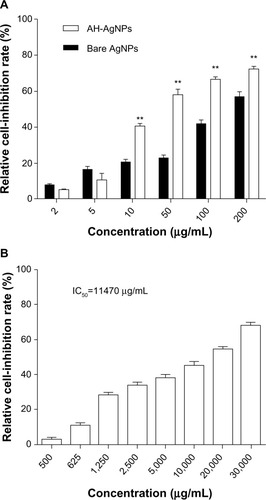
Figure S1 TEM image of bare Ag nanoparticles synthesized by a chemical method.
Abbreviation: TEM, transmission electron microscopy.
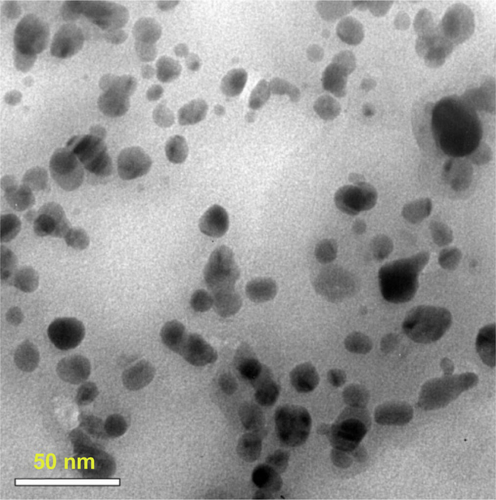
Figure S2 (A and B) DLS patterns. (A) Size distribution of bare AgNPs; (B) zeta-potential analysis of bare Ag nanoparticles.
Abbreviation: DLS, dynamic light scattering.