Figures & data
Figure 1 Scheme of nanocoating of insulin or insulin-chitosan microparticles in the nanoengineered polysaccharide capsules.
Notes: The insulin microparticles were formed in 10% PEG 6000, and alternating layers of chitosan and heparin were then applied in the presence of 10% PEG, thereby forming multilayers encapsulating insulin or insulin-chitosan microparticles.
Abbreviation: PEG, poly(ethylene) glycol.
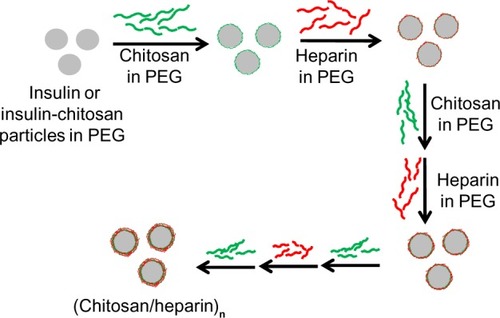
Figure 2 Insulin loss during the formation of microparticles by precipitation at pH 5.5.
Notes: Most insulin was associated with the microparticles (least loss into solution) when precipitated with both chitosan and PEG (n=3; *P<0.001 versus insulin-alone particles in buffer). Inset: insulin loss as a function of the chitosan concentration in the precipitating solution. The ratio of volume of insulin and chitosan was kept constant at 1:1.
Abbreviation: PEG, poly(ethylene) glycol.
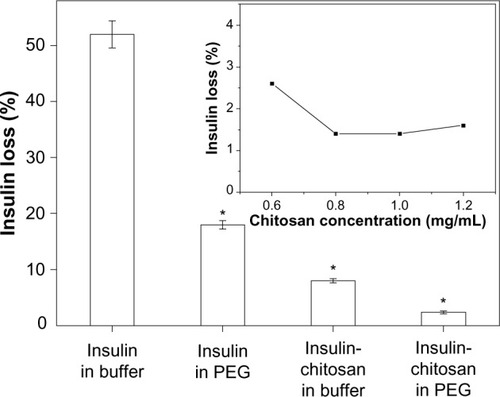
Figure 3 Insulin particle appearance and insulin loss during deposition of nanolayers.
Notes: (A) Bright-field and fluorescence light microscope images of (1) the spherical insulin particles, (2) insulin particles coated with the first layer of chitosan-FITC, (3) insulin-chitosan particles, and (4) insulin-chitosan particles coated with the first layer of chitosan-FITC. The particles and the coating were prepared in the presence of 10% PEG 6000 (the final concentration after mixing). Note that images are from different batches of the particles. (B and C) Insulin loss during the deposition of the first two layers and the wash step. (B) Insulin, (C) insulin-chitosan (n=3; *P<0.001) in the presence of PEG versus without PEG.
Abbreviations: PEG, poly(ethylene) glycol; FITC, fluorescein-5-isothiocyanate.
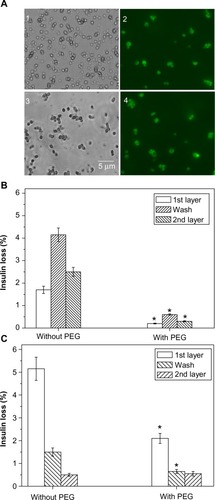
Figure 4 Bright-field and fluorescent images of the nanoencapsulated insulin (A) and nanoencapsulated insulin-chitosan (B) microparticles at pH 2.0 and 7.2, respectively.
Notes: Left: bright-field; right: fluorescence. Insets: images of the microcrystals/microparticles, imaged using scanning electron microscopy.
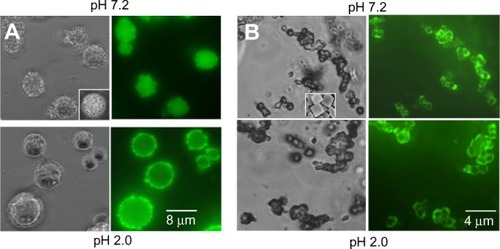
Figure 5 pH-sensitive insulin release in vitro from the insulin and insulin-chitosan particles with and without nanoencapsulation with seven layers (n=3).
Notes: Release time studied was 2 hours. All data points P<0.001 versus insulin-alone particles. P-levels are not shown on the graph for clarity.
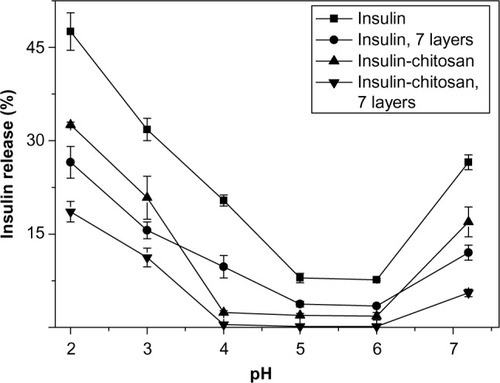
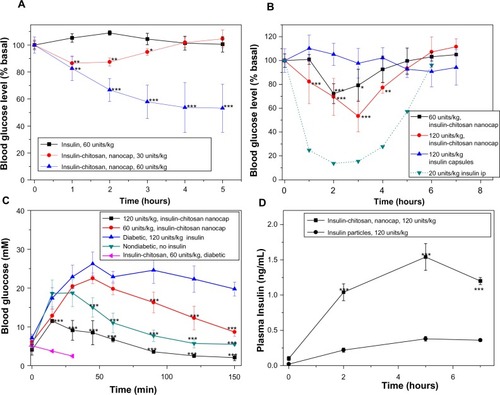
Figure 6 Blood glucose level changes relative to the baseline values after the oral insulin and insulin-chitosan microparticles (encapsulated with seven layers and controls) in diabetic mice.
Notes: (A) Fasted mice, (B) fed mice, and (C) effect of the oral insulin and insulin-chitosan on the blood glucose levels after intraperitoneal glucose challenge in the overnight-fasted diabetic and nondiabetic mice (n=4 or 5). (D) Plasma insulin level after the oral administration of insulin (control) and insulin-chitosan particles (nanoencapsulated with seven layers; n=4). *P<0.05; **P<0.01; ***P<0.001, insulin-chitosan versus insulin-alone capsules.
Abbreviations: ip, intraperitoneal; min, minutes; nanocap, nanoencapsulated.