Figures & data
Figure 1 Structure of the nanostructured biosensor. (A) Schematic representation and (B) practical fabricated device after assembly and connecting of wires.
Abbreviations: GNPs, gold nanoparticles; AAO, anodic aluminum oxide; AB, epoxy and modified amine curing agent.
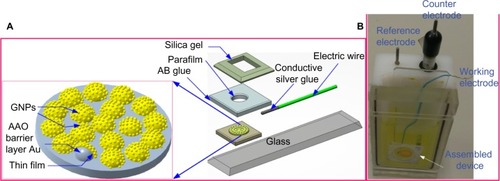
Figure 2 Anodic aluminum oxide membrane fabrication setup.
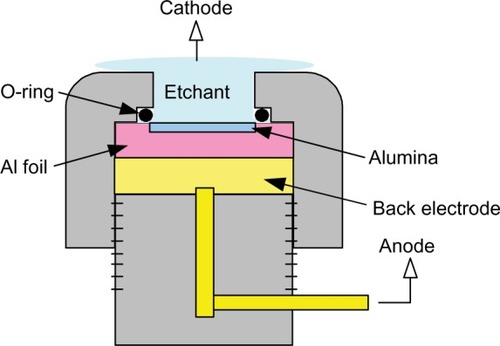
Table 1 Base sequences of the probe and target oligonucleotide sequences
Figure 3 Scanning electron microscopic image of the GNP-deposited nanostructured electrode.
Abbreviation: GNP, gold nanoparticles.
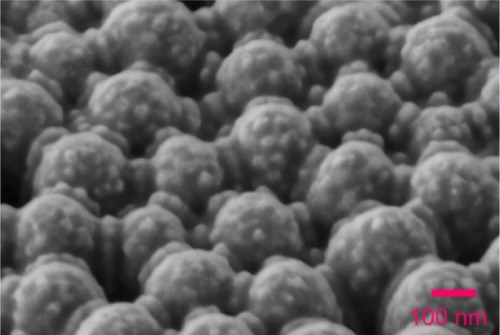
Figure 4 Cyclic voltammogram for the AAO/Au thin film electrode and the AAO/Au thin film/GNP electrode in a solution of 20 mM K4Fe(CN)Citation6 with 0.1 M KCl as the supporting electrolyte; (A) I–V curve (B) I–t curve.
Abbreviations: AAO, anodic aluminum oxide; GNP, gold nanoparticles.
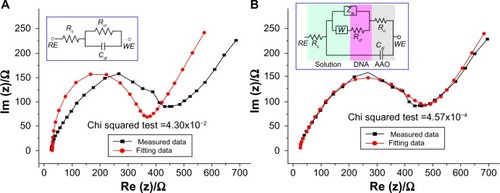
Figure 5 Equivalent circuit model for the nanostructured biosensor. (A) Randles circuit and (B) the proposed circuit model.
Abbreviation: AAO, anodic aluminum oxide.

Figure 6 Optimization of capture probe immobilization.
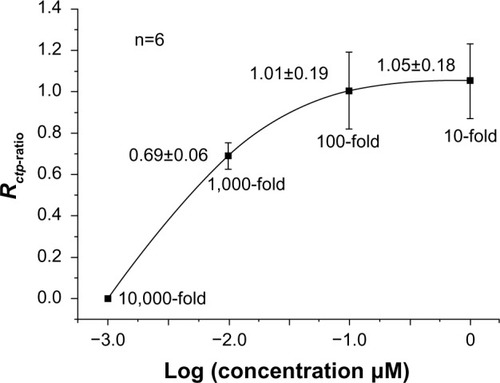
Figure 7 Gel electrophoresis confirmation of complementary target hybridization.
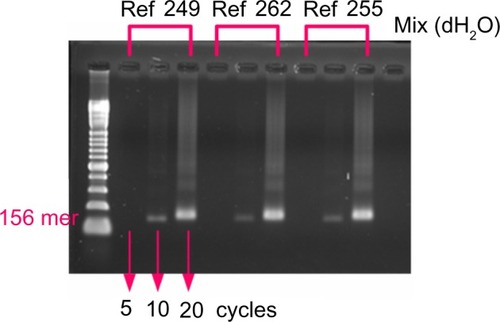
Figure 8 X-ray photoelectron spectrum of the electrode surface. (A) X-ray photoelectron spectrum of the GNP deposited, the ssDNA probe immobilized, and the complementary target hybridized electrode surfaces. (B–D) spectrums for N1s, O1s, and C1s.
Abbreviations: GNP, gold nanoparticles; ssDNA, single-stranded DNA; ds, double-stranded DNA.
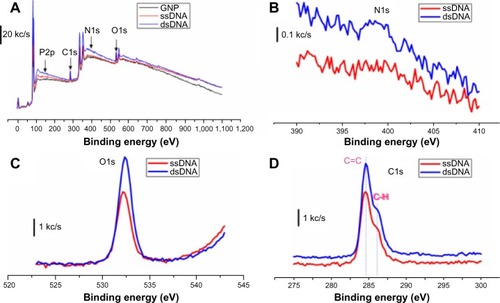
Table 2 Fitting parameters for discrimination experiments with (A) matched samples and (B) nonmatched samples
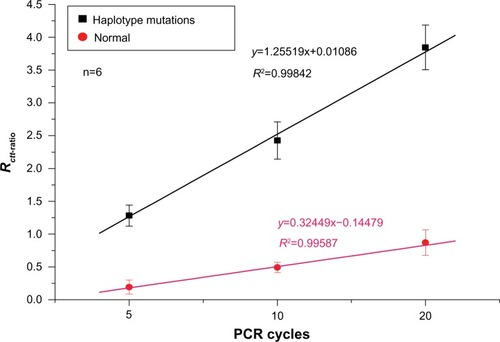
Figure 9 Discrimination between haplotype-mutated and normal target samples.
Abbreviation: PCR, polymerase chain reaction.