
Figures & data
Figure 1 Molecular structure of protocatechuic acid (A) and protocatechuic acid anion, protocatechuate (B).
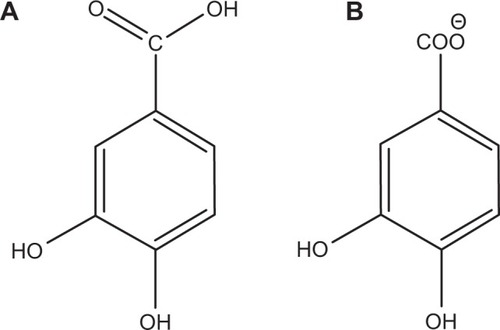
Figure 2 Powder X-ray diffraction patterns of ZnO (A), PAN (B) and protocatechuic acid (C).
Abbreviation: PAN, protocatechuic acid nanocomposite.
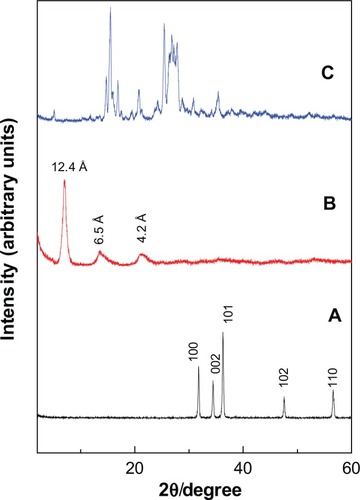
Figure 3 Three-dimensional molecular size of PA (A) and spatial orientation of PA intercalated between interlayers of ZLH (B).
Abbreviations: PA, protocatechuic acid; ZLH, zinc-layered hydroxide.
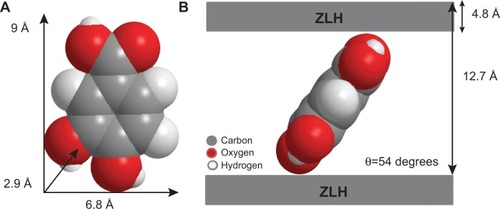
Figure 4 Fourier transform infrared spectra of PA (A) and PAN (B).
Abbreviations: PA, protocatechuic acid; PAN, protocatechuic acid nanocomposite.
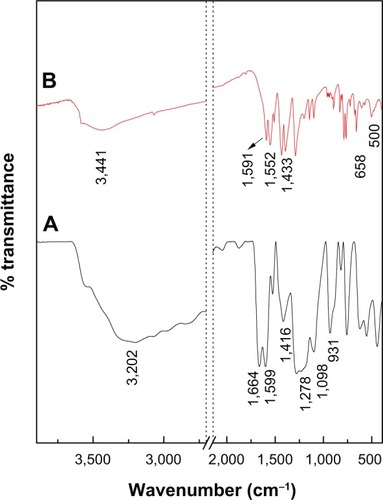
Table 1 Physicochemical properties of ZnO and PAN
Figure 5 Thermogravimetric and differential thermogravimetric analyses of protocatechuic acid (A) and PAN (B).
Abbreviation: PAN, protocatechuic acid nanocomposite.
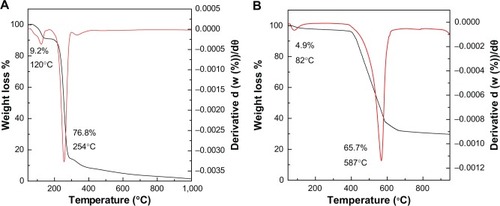
Figure 6 Adsorption-desorption isotherms for ZnO and PAN (A), and Barret-Joyner-Halenda method pore size distribution for ZnO and PAN (B).
Abbreviations: PAN, protocatechuic acid nanocomposite; STP, standard temperature and pressure.
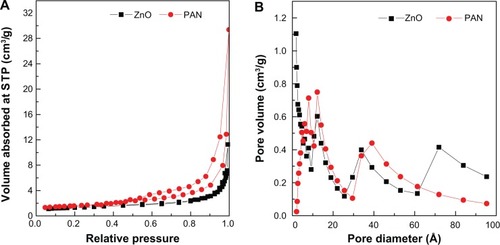
Figure 7 Field emission scanning electron micrograph of ZnO (at 50,000× [A] and 100,000× [B]) and protocatechuic acid nanocomposite (at 50,000× [C] and 100,000× [D]).
![Figure 7 Field emission scanning electron micrograph of ZnO (at 50,000× [A] and 100,000× [B]) and protocatechuic acid nanocomposite (at 50,000× [C] and 100,000× [D]).](/cms/asset/9da45eb5-39d0-42df-9f4e-8cd6f9d7d1d9/dijn_a_59541_f0007_b.jpg)
Figure 8 TEM images of ZnO (A), and PAN (B).
Abbreviations: TEM, transmission electron microscope; PAN, protocatechuic acid nanocomposite.
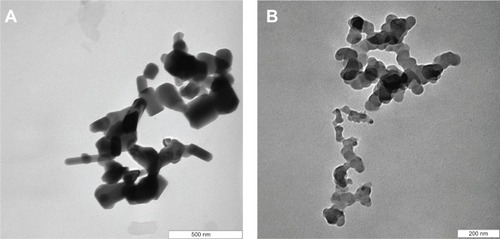
Figure 9 Release profiles of a physical mixture of protocatechuic acid with zinc layered hydroxide at pH 7.4 and pH 4.8 (A) and release profiles of protocatechuate from protocatechuic acid nanocomposite at pH 7.4 and pH 4.8 (B).
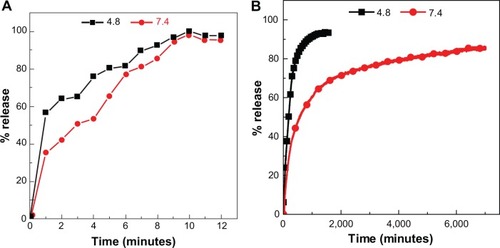
Table 2 Correlation coefficient (R2), rate constants (k), and half life (t1/2) values obtained by fitting the data of the release of PA from PAN into phosphate-buffered saline at pH 4.8 and 7.4
Figure 10 Fitting of the data for PA release from PAN into various solutions to the pseudo-first order, pseudo-second order kinetics and parabolic diffusion model for pH 7.4 (A–C) and pH 4.8 (D–F).
Abbreviations: PA, protocatechuic acid; PAN, protocatechuic acid nanocomposite; M0, amount of protocatechuic acid between the layers at release time 0; Mt, amount of protocatechuic acid between the layers at release time t; qe, amount of protocatechuic acid released at equilibrium; qt, amount of protocatechuic acid released at time t; k, release rate constant.
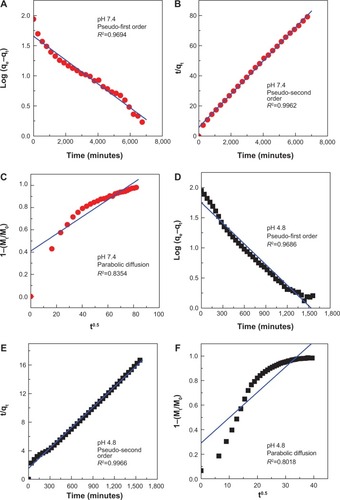
Figure 11 Cell viability (MTT assay) of 3T3, HeLa, HepG2 and HT29 cell lines exposed to various gradient concentrations.
Note: The data presented are mean ± standard deviation of triplicate values.
Abbreviations: PAN, protocatechuic acid nanocomposite; MTT, methylthiazol tetrazolium.
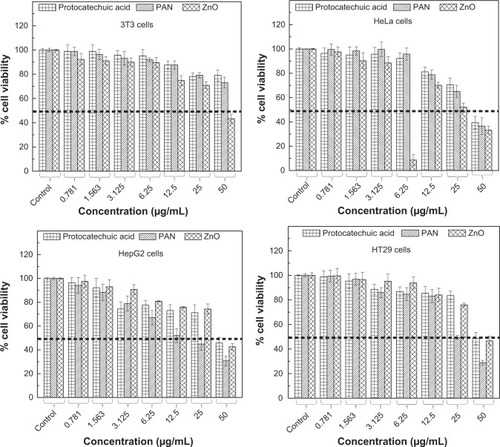
Table 3 The half maximal inhibitory concentration (IC50) value for PA, PAN and ZnO samples tested on 3T3, HeLa, HepG2 and HT29 cell lines