Figures & data
Figure 1 Schematic of the synthesis and mechanism of nanoparticles for tumor targeting.
Abbreviations: CS, chitosan; LDL, low-density lipoprotein; NHS, N-hydroxysuccinimide; NPs, nanoparticles; NSC, N-succinyl-chitosan; Ost, osthole; EDC, 1-(3-Dimethylamino-propyl)-3-ethylcarbodiimide; Endo, endosome.
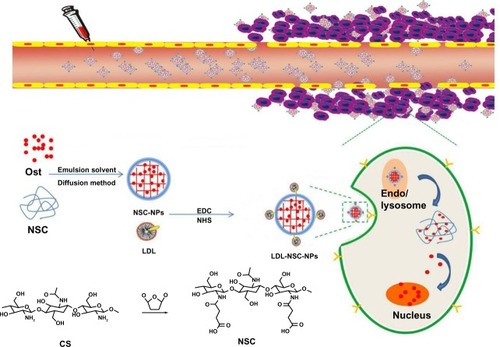
Figure 2 FTIR spectra of CS (A) and NSC (B).
Abbreviations: CS, chitosan; FTIR, Fourier transform infrared spectroscopy; NSC, N-succinyl-chitosan.
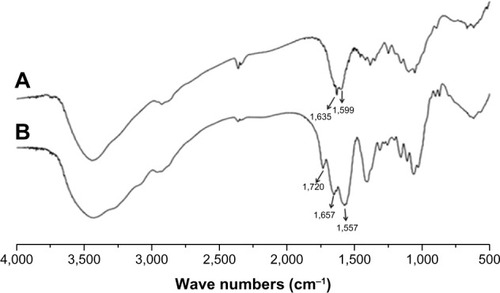
Figure 3 1H-NMR spectra of CS (A) in D2O and DCL (9:1, v/v) and of NSC (B) in D2O.
Abbreviations: CS, chitosan; D2O, deuterium; DCL, deuterium chloride; 1H-NMR, proton nuclear magnetic resonance; NSC, N-succinyl-chitosan.
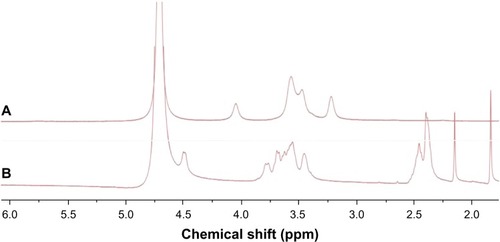
Figure 4 Morphology and particle size of Ost/NSC-NPs as shown by TEM (A) and AFM (B).
Abbreviations: ATM, atomic force microscopy; NPs, nanoparticles; NSC, N-succinyl-chitosan; Ost, osthole; TEM, transmission electron microscopy.
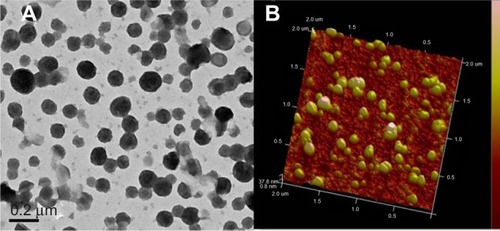
Figure 5 In vitro release of Ost from nanoparticles in various media compared with Ost alone.
Abbreviations: NPs, nanoparticles; NSC, N-succinyl-chitosan; Ost, osthole.
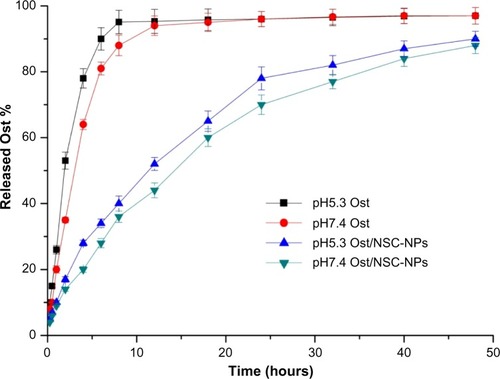
Figure 6 Cytotoxic effects of various formulations against HepG2 in vitro.
Notes: Ost concentration (μg·mL−1)/NSC concentration (μg·mL−1): (1) 10/50, (2) 20/100, (3) 40/200, (4) 80/400, (5) 160/800, and (6) 320/1600; *represents P<0.05 versus Ost group; **represents P<0.01 versus Ost group; #represents P<0.01 versus Ost/NSC-NPs group; n=3.
Abbreviations: LDL, low-density lipoprotein; NPs, nanoparticles; NSC, N-succinyl-chitosan; Ost, osthole.
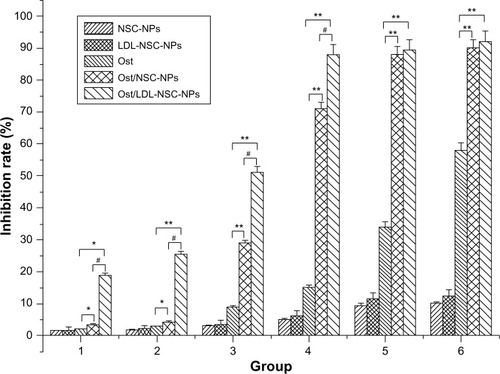
Figure 7 Effects of Ost, Ost/NSC-NPs, and Ost/LDL-NSC-NPs on HepG2 apoptosis.
Notes: HepG2 cells were treated with (A) negative control, (B) NSC-NPs, (C) LDL-NSC-NPs, (D) 100 μg·mL−1 Ost, (E) 100 μg·mL−1 Ost/NSC-NPs, and (F) 100 μg·mL−1 Ost/LDL-NSC-NPs, and then stained with Hoechst 33258 (blue).
Abbreviations: LDL, low-density lipoprotein; NPs, nanoparticles; NSC, N-succinyl-chitosan; Ost, osthole.
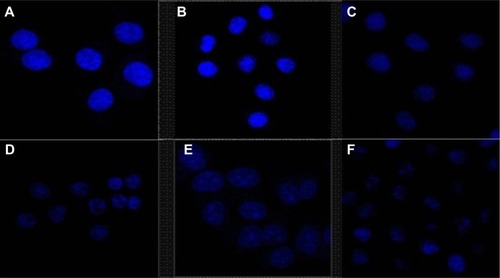
Figure 8 Apoptosis was also verified through flow cytometry.
Notes: HepG2 cells were treated with (A) negative control, (B) NSC-NPs, (C) LDL-NSC-NPs, (D) 100 μg·mL−1 Ost, (E) 100 μg·mL−1 Ost/NSC-NPs, and (F) 100 μg·mL−1 Ost/LDL-NSC-NPs, and then stained with Annexin V–FITC and PI. Flow cytometry profile shows Annexin V–FITC staining on the x-axis and PI on the y-axis.
Abbreviations: FITC, fluorescein isothiocyanate; LDL, low-density lipoprotein; NPs, nanoparticles; NSC, N-succinyl-chitosan; Ost, osthole; PI, propidium iodide; FL, fluorescence.
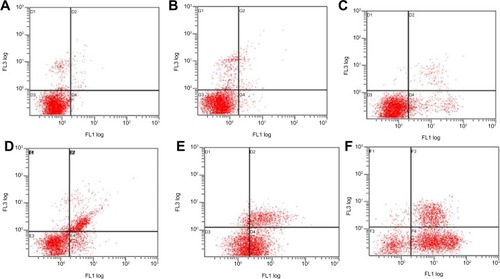
Figure 9 Percentage of early apoptosis induced by Ost formulations.
Notes: (1) Negative control, (2) NSC-NPs, (3) LDL-NSC-NPs, (4) 100 μg·mL−1 Ost, (5) 100 μg·mL−1 Ost/NSC-NPs, and (6) 100 μg·mL−1 Ost/LDL-NSC-NPs; **represents P<0.01 versus Ost group; ##represents P<0.01 versus Ost/NSC-NP group; n=3.
Abbreviations: LDL, low-density lipoprotein; NPs, nanoparticles; NSC, N-succinylchitosan; Ost, osthole.
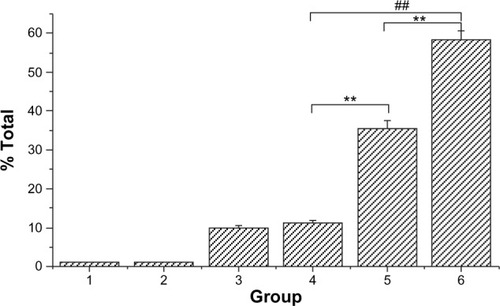
Table 1 Percentage of HepG2 cells in various phases of the cell cycle after incubation with various Ost formulations (equivalent Ost concentration =100 μg·mL−1)
Figure 10 Analysis of DNA content in cell cycle using a flow cytometer.
Notes: HepG2 cells were treated with (A) negative control, (B) NSC-NPs, (C) LDL-NSC-NPs, (D) 100 μg·mL−1 Ost, (E) 100 μg·mL−1 Ost/NSC-NPs, and (F) 100 μg·mL−1 Ost/LDL-NSC-NPs.
Abbreviations: LDL, low-density lipoprotein; NPs, nanoparticles; NSC, N-succinyl-chitosan; Ost, osthole.
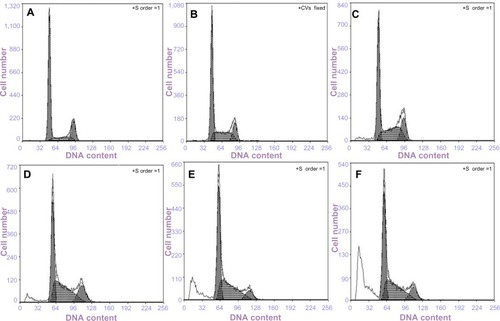
Figure 11 Flow cytometry analysis of drug uptake.
Notes: (A) Incubation with (a) control; (b) Ost/FITC-NSC-NPs, 30 minutes; (c) Ost/FITC-NSC-NPs, 1 hour; (d) Ost/FITC-NSC-NPs, 3 hours; (e) Ost/FITC-LDL-NSC-NPs, 30 minutes; (f) Ost/FITC-LDL-NSC-NPs, 1 hour; and (g) Ost/FITC-LDL-NSC-NPs, 3 hours. (B) Mean fluorescent intensity of Ost in HepG2 as examined by flow cytometry.
Abbreviations: FITC, fluorescein isothiocyanate; h, hour(s); LDL, low-density lipoprotein; min, minutes; NPs, nanoparticles; NSC, N-succinyl-chitosan; Ost, osthole; FL, fluorescence.
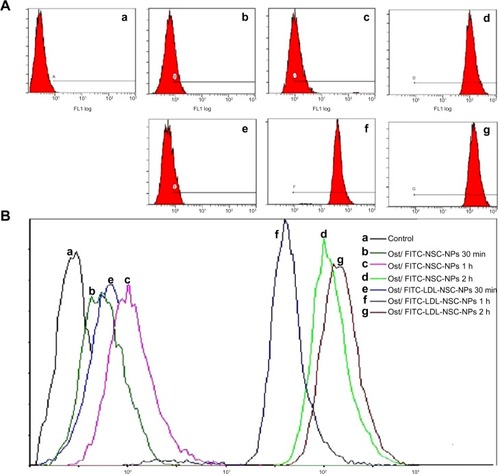
Figure 12 Subcellular localization of different FITC-labeled NPs evaluated by confocal laser scanning microscopy after incubation with (A) Ost/FITC-NSC-NPs, 30 minutes; (B) Ost/FITC-LDL-NSC-NPs, 30 minutes; (C) Ost/FITC-NSC-NPs, 1 hour; (D) Ost/FITC-LDL-NSC-NPs, 1 hour; (E) Ost/FITC-NSC-NPs, 3 hours; and (F) Ost/FITC-LDL-NSC-NPs, 3 hours.
Notes: FITC-labeled NPs, green (a); cell nuclei stained with Hoechst 33258, blue (b); overlay of (a) and (b) (c).
Abbreviations: FITC, fluorescein isothiocyanate; LDL, low-density lipoprotein; NPs, nanoparticles; NSC, N-succinyl-chitosan; Ost, osthole.
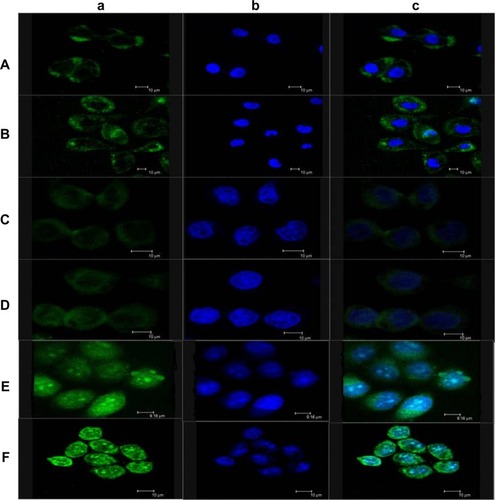
Figure 13 Atomic force microscopy image of HepG2 cells.
Notes: Blank HepG2 cells (A); HepG2 cells after treatment with Ost/LDL-NSC-NPs (B).
Abbreviations: LDL, low-density lipoprotein; NPs, nanoparticles; NSC, N-succinyl-chitosan; Ost, osthole.
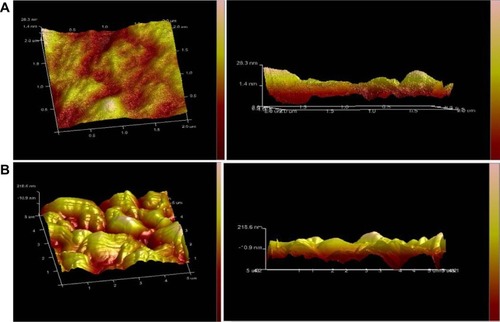
Figure 14 Size distribution histogram of protrusions on HepG2 cells.
Notes: Blank HepG2 cells (A); HepG2 cells after treatment with Ost/LDL-NSC-NPs (B).
Abbreviations: LDL, low-density lipoprotein; NPs, nanoparticles; NSC, N-succinyl-chitosan; Ost, osthole.
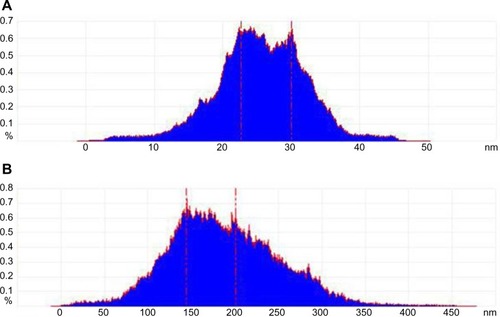
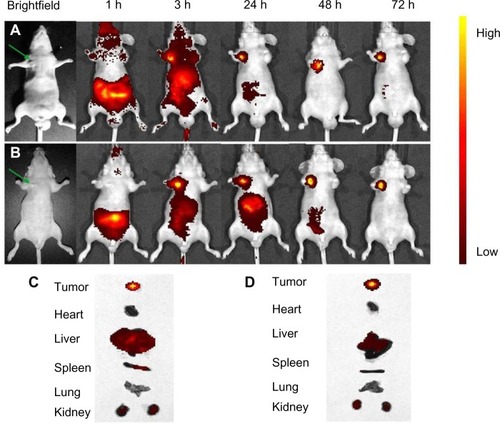
Figure 15 In vivo fluorescence imaging of subcutaneous tumor-bearing nude mice after intravenous injection of Cy7-labeled NSC-NPs (A) and Cy7-labeled LDL-NSC-NPs (B).
Notes: Images of dissected organs of nude mice bearing subcutaneous tumor sacrificed 72 hours after intravenous injection of Cy7-labeled NSC-NPs (C) and Cy7-labeled LDL-NSC-NPs (D), respectively. The green arrow points to the tumor location.
Abbreviations: Cy7, cyanine 7; h, hour(s); LDL, low-density lipoprotein; NPs, nanoparticles; NSC, N-succinyl-chitosan.