Figures & data
Figure 1 3-D (left) and 2-D (right) schematic representation of human rotavirus A. The color code is shown with respect to the main proteins of the capsid.
Abbreviation: RNA, ribonucleic acid.
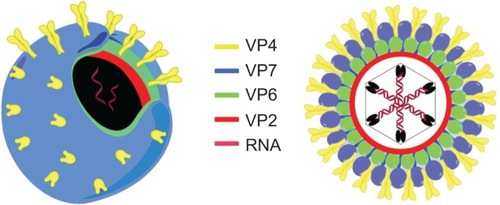
Table 1 Primers used in this study
Figure 2 Sodium dodecyl sulfate polyacrylamide gel electrophoresis (SDS-PAGE; Coomassie blue staining) analysis of VP6 fusion proteins expression in Escherichia coli. (A) Lane 1, protein marker; lane 2, soluble cell extract from the uninduced culture transformed with pET15b-VP6; lane 3, soluble cell extract of the induced culture transformed with pET15b-VP6; lane 4, soluble cell extract from the uninduced culture transformed with pTRX-VP6; lane 5, soluble cell extract of the induced culture transformed with pTRX-VP6; lane 6, soluble cell extract of the uninduced culture transformed with pET-SUMO-VP6; lane 7, soluble cell extract of the induced culture transformed with pET-SUMO-VP6. (B) Lane 1, protein marker; lane 2, insoluble cell extract from the uninduced culture transformed with pET15b-VP6; lane 3, insoluble cell extract of the induced culture transformed with pET15b-VP6; lane 4, insoluble cell extract from the uninduced culture transformed with pTRX-VP6; lane 5, insoluble cell extract of the induced culture transformed with pTRX-VP6; lane 6, insoluble cell extract of the uninduced culture transformed with pET-SUMO-VP6; lane 7, insoluble cell extract of the induced culture transformed with pET-SUMO-VP6. The position of each fusion protein in the SDS-PAGE gel is marked by a black arrow.
Abbreviations: SUMO, small ubiquitin-like modifier; TRX, thioredoxin.
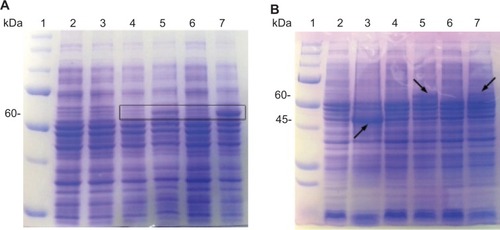
Figure 3 Purification profile of small ubiquitin-like modifier (SUMO)-VP6 fusion protein. (A) Sodium dodecyl sulfate polyacrylamide gel electrophoresis stained with Coomassie blue. A small volume of 250 mL of isopropyl β-D-1-thiogalactopyranoside-induced BL21(DE3) Escherichia coli culture transformed with pET-SUMO-VP6 was lysed in 10 mL lysis buffer and applied to 1.5 mL of Ni2+-nitrilotriacetic acid resin. After an extensive wash, the fusion protein was eluted with a 10-column volume of elution buffer and collected in single 1.5 mL fractions. Lane 1, protein marker; lanes 2–6, 1 μL of 1.5 mL (1:1,500) of the first five elution fractions of SUMO-VP6. (B) Western blot analysis of purified SUMO-VP6 using monoclonal antibodies against His6-tag. Lane 1, molecular mass marker; lane 2, recombinant fusion protein.
Abbreviation: His, histidine.
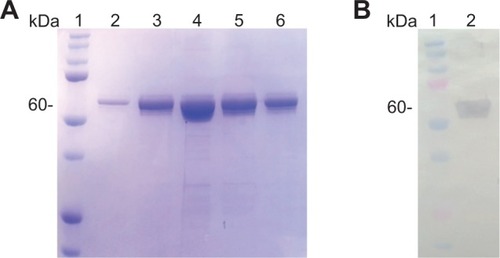
Figure 4 Proteolytic cleavage of small ubiquitin-like modifier (SUMO)-VP6 fusion proteins. (A) Sodium dodecyl sulfate polyacrylamide gel electrophoresis (SDS-PAGE) stained with Coomassie blue with purified SUMO-VP6 fusion protein before (lane 2) and after (lane 3) digestion by SUMO protease. After the protease digestion, the protein solution was passed through an Ni2+ resin column, and the flow-through was collected and analyzed by SDS-PAGE (lane 4). SUMO was retained in the Ni2+ resin because it contained an His6 tag. Molecular weight standards are shown on the left. (B) Western blot analysis of purified SUMO-VP6 and cleaved VP6 after protease digestion using anti-VP6-specific antiserum.
Abbreviation: His, histidine.
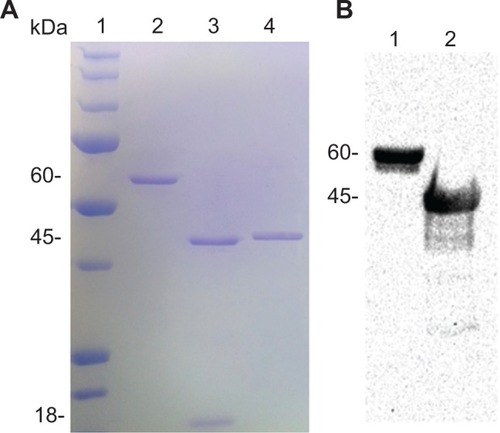
Figure 5 Transmission electron microscopy (TEM) images of nanostructures revealed at different pH and ionic strength. (A) 20 mM Acetate buffer, pH 4.5, NaCl 150 mM. The TEM micrograph shows nearly spherical nanoparticles with a diameter size variability that has been estimated to be 60±15 nm. The bar at the bottom of the picture corresponds to 200 nm. (B) Zoom of a single nanoparticle of (A). The bar at the bottom of the picture corresponds to 50 nm. (C) 20 mM 2-(N-morpholino)ethanesulfonic acid buffer, pH 6, NaCl 150 mM. The TEM micrograph shows long rods with a lateral dimension of 40–100 nm and a length in the order of a few millimeters. The bar at the bottom of the picture corresponds to 500 nm. (D) 20 mM Tris HCl in the presence of 150 mM NaCl and 200 mM CaCl2. The TEM image reveals the presence of small spots that are compatible with the expected presence of VP6 trimers.Citation5 The bar at the bottom of the picture corresponds to 200 nm.
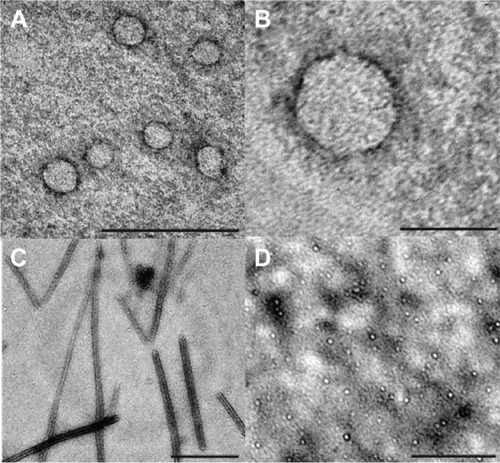
Figure 6 Atomic force microscopy images collected in contact operation mode, at different pH and ionic strength. (A) Representative 2-D image of a spherical virus-like particle detected at pH 4.5. (B, D) 3-D representation of the same images in (A) and (C), respectively. (C) Representative 2-D image of an elongated wormlike nanotube detected at pH 6.
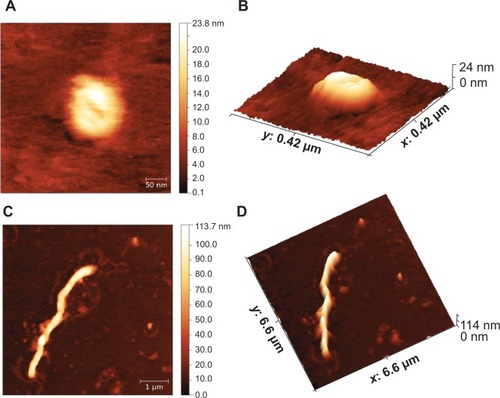
Figure 7 Detection of immunoglobulin (Ig)-G and IgA in serum samples from immunized BALB/c mice. Native VP6 recombinant proteins, VLP-VP6, and NT-VP6 (10 μg) were subcutaneously administered to three groups of mice (four mice/experimental group) on days 0, 21, and 42. Serum specimens were collected on day 63, and tested by ELISA for specific IgG and IgA against VP6 antigen. Serum from the naïve group was used as a control. (A) Serum IgG titers at 1:16,000 dilution on days 0, 21, 42, and 64. Titers were defined as the highest dilution yielding an optical density (OD) of 0.2 or greater relative to normal control mouse sera. (B) Serum IgG detection: termination sera were tested in ELISA at twofold dilutions. (C) Serum IgG detection at 1:16,000 dilution. (D) Serum IgA detection at 1:1,000 dilution: different antigen formulations administered to four mice per experimental group are reported on the x-axis. The cutoff for positive values was 0.2. The values shown on the y-axis are the OD values at 490 nm of each individual serum and the mean OD of the group (horizontal bar).
Abbreviations: VLP, virus-like particle; NT, nanotube; ELISA, enzyme-linked immunosorbent assay; prot, protocol.
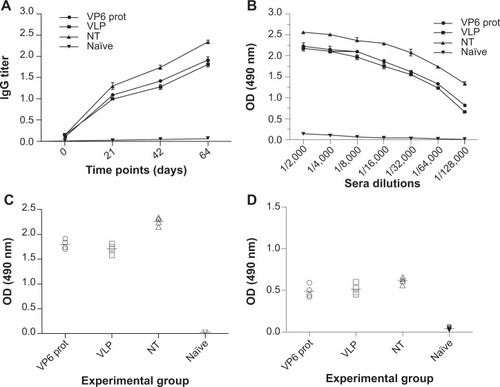
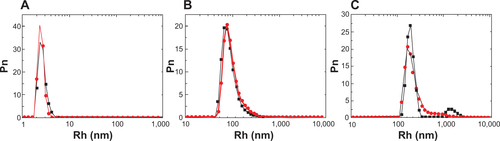
Figure S1 Hydrodynamic radius (Rh) number distribution (Pn) of the three VP6 structural assemblies obtained in the three different experimental conditions. (A) Hydrodynamic radius number distribution of the VP6 trimers in 20 mM Tris HCl pH 7.4, 150 mM NaCl, and 200 mM CaCl2 (black dots) and diluted 1:10 in phosphate-buffered saline (PBS; red dots). (B) Hydrodynamic radius number distribution of the VP6 spherical nanoparticles in 20 mM acetate buffer pH 4.5 NaCl 150 mM (black dots) and diluted 1:10 in PBS (red dots). (C) Hydrodynamic radius number distribution of the VP6 long rods in 20 mM 2-(N-morpholino)ethanesulfonic acid buffer, pH 6, NaCl 150 mM (black dots) and diluted 1:10 in PBS (red dots).