Figures & data
Figure 1 A–H Physicochemical characterization of SurR9-C84A loaded PLGA NPs.
Notes: (A) Sodium dodecyl sulfate gel and (B) Western blot for SurR9-C84A purified using the glutathione agarose column. A concentration of 40 μg/mL of the protein was loaded in each well and run through 12.5% gel, and later transferred onto a polyvinylidene difluoride membrane for SurR9-C84A detection. (C) Scanning electron microscopy images of the void and (D) SurR9-C84A-loaded PLGA NPs. (E) In vitro release of SurR9-C84A from the PLGA NPs at pH 2 and 7.4, representing the acidic and neutral pH ranges that the NPs would encounter. The protein release reached saturation in 3 days at both pH ranges. (F) Differential scanning calorimetry curve for the void and SurR9-C84A-loaded PLGA NPs. A temperature range of 0°C–250°C was used with a heat-flow increment of 10°C/minute. An endothermic peak was observed at 52°C, with no detectable changes comparatively between the void and protein-loaded NPs, inferring the amorphous nature of the protein upon encapsulation in the NPs. (G) Fourier-transform infrared spectra for the void and protein-loaded NPs. The peaks observed in the range of 1,650 cm−1 and 1,540 cm−1 corresponded to the amide I and II bands, respectively, inferring protein integrity and encapsulation. (H) The marker, void, and SurR9-C84A-loaded NPs were run through a 12.5% gel at 200 V. A protein concentration of 40 μg/mL was loaded for the detection of SurR9-C84A in the NPs. Presence of a 16 kDa band indicated both the successful encapsulation of the protein and its structural integrity.
Abbreviations: PLGA, poly(lactic-co-glycolic acid); NPs, nanoparticles; GST, glutathione S-transferase.
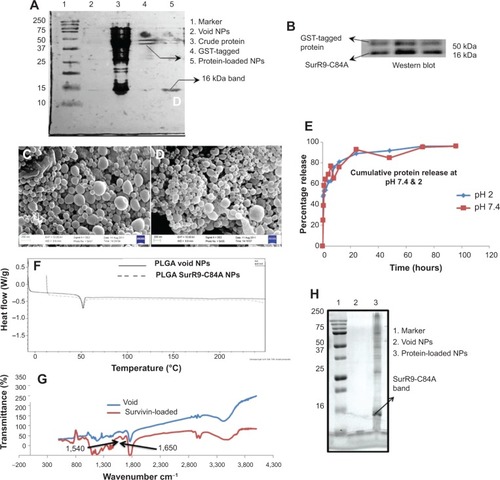
Table 1 List of primer sequences used in the study
Table 2 Encapsulation efficiency (EE) and the percentage of SurR9-C84A loading in the PLGA NPs
Figure 2 A–P Determination of NP internalization and uptake mechanism.
Notes: (A, B) Undifferentiated and (C, D) differentiated SK-N-SH cells. Cells were incubated with SurR9-C84A NPs, and within 1 hour NPs accumulated around the perinuclear spaces, followed by nuclear localization in 2 hours. Arrows represent the rhodamine-labeled NPs. (E) Histogram representing average ± standard deviation of the NPs present inside the cells counted in five different fields. (F) SK-N-SH cells before and (G) after treatment with retinoic acid 20 μM. Cells were considered to be differentiated with the development of neurite processes, as indicated with arrowheads. (H–M) Flow cytometry confirming the NP-uptake mechanism through clathrin-mediated endocytosis. Chlorpromazine a clathrin-mediated endocytic inhibitor showed significant (2.5-fold) reduction in the uptake compared to the controls, while sodium azide and colchicine lowered uptake by 1.7- and 1.5-fold, respectively. Thus, it confirmed the involvement of energy dependent and macropinocytosis uptake mechanisms. (N) The NP-uptake mechanism was redetermined by pretreating the cells with the endocytic inhibitors chlorpromazine (10 μg/mL, clathrin-mediated endocytosis), indomethacin (10 μg/mL, caveolae-mediated endocytosis), sodium azide (2 μg/mL), and colchicine (5 μg/mL, pinocytosis) for 1 hour, followed by rhodamine-labeled NPs incubation for 4 hours at 1 mg/mL concentration. After treatment, cells were washed with phosphate-buffered saline to remove free NPs, and then the cells were lysed with 1% Triton-X in 0.2 M NaOH. The resulting fluorescence was measured at 530 nm excitation and 630 nm emission, and the corresponding weights of the NPs were calculated from the standard graph plotted for rhodamine-labeled NPs. (O) Merge images showing the expression of wild-type survivin in differentiated and (P) undifferentiated SK-N-SH cells. Undifferentiated cells showed the maximum expression of survivin, confirming proliferation, while negligible expression was observed in differentiated SK-N-SH cells, indicating a poor proliferation rate. *P<0.05; **P<0.01 (Student’s t-test).
Abbreviation: NPs, nanoparticles.
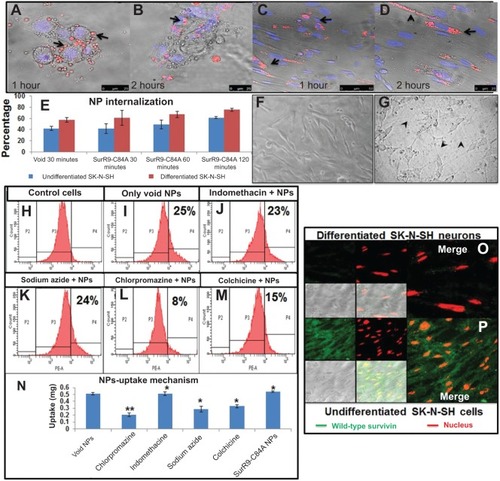
Figure 3 A–K Schematic representation of antitumor effects of SurR9-C84A-loaded NPs in undifferentiated SK-N-SH cells.
Notes: Caspase 3 (Cas-3) expression in undifferentiated SK-N-SH cells after treatment for 24 hours in (A) control and (B) SurR9-C84A treatments. A dose-dependent increased expression of Cas-3 was evident with the treatments, indicating the follow-through of apoptosis. Cas-3 expression is shown in the fluorescein isothiocyanate (FITC) channel (green), indicated by arrowheads, and evident in the protein-treated cells compared to the control. The nucleus is stained red with propidium iodide (PI), and bright-field (BF) and merge images are also shown. (C, D) PCNA expression in undifferentiated SK-N-SH cells after treatment for 24 hours with SurR9-C84A-loaded NPs. A dose-dependent decreased expression of PCNA was evident with the treatments in undifferentiated SK-N-SH cells. PCNA expression is shown in the FITC channel (green), and the nucleus is stained red with PI. BF and merge images are also shown. All the images were taken at 40×. (E) Histogram representing means ± standard deviation of PCNA expression in cells counted in five independent fields. (F) Percentage of cells alive and dead after treatment with SurR9-C84A-loaded NPs for 24 hours. Cells were seeded in 96-well plates, and after treatment live and dead cell assays were performed to determine the percentage of cells alive and dead, as per the instructions. NP-loaded SurR9-C84A (50 μg/mL) was equally effective compared to the 75 μg/mL concentration of pure SurR9-C84A (without NPs) included in the study. (G) The percentage proliferation of cells was determined through CyQuant assay. The NP-treated cells showed a dose-dependent decrease in proliferation, with almost 50% reduction posttreatment. Fetal bovine serum (FBS; 20%) was used as a positive control. (H) Annexin-V-Fluos staining for the untreated controls; (I) SurR9-C84A-loaded NP-treated cells. The treatment group showed 31.8% cell death. (J) PI staining for the untreated controls; (K) SurR9-C84A-loaded NP-treated cells. SurR9-C84A-treated groups showed 84.8% positivity for PI, indicating its cytotoxic potential. *P<0.05. Data are presented as means ± standard deviation, n=3.
Abbreviations: NPs, nanoparticles; PE, phycoerythrin; PCNA, proliferating cell nuclear antigen.
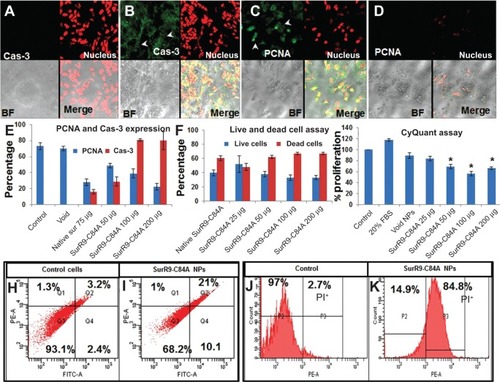
Figure 4 A–J Proliferative and neuroprotective potential of SurR9-C84A on differentiated SK-N-SH neuronal cells.
Notes: Differentiated SK-N-SH cells were observed for expression of the proliferating markers PCNA and Ki67 in (A, D) untreated control and (B, E) SurR9-C84A-treated cells after treatment for 24 hours. Dose-dependent increased expression of PCNA and Ki67 was evident with the treatments in differentiated SK-N-SH cells. PCNA and Ki67 expression is shown in the fluorescein isothiocyanate (FITC) channel (green), and the nucleus is stained red with propidium iodide (PI). Bright-field (BF) and merge images are also shown. The arrow heads represent the PCNA expression. All the images were taken at 40×. (C) Histogram of means ± standard deviation of PCNA and Ki67 expression in the cells counted in five independent fields. (F) Bromodeoxyuridine (BrdU) assay in differentiated SK-N-SH cells after SurR9-C84A treatment. BrdU is an analog of thymidine, and dividing cells incorporate it into their deoxyribonucleic acid. Therefore, cells that are BrdU+ indicate proliferation and is concentration-dependent with the treatments. (G) Annexin-V-Fluos staining for the untreated controls, and (H) SurR9-C84A-loaded NP-treated cells. The treatment group were 98.1% annexin−, indicating the cytoprotective nature of SurR9-C84A. (I) PI staining for the untreated controls, and (J) SurR9-C84A-loaded NP-treated cells. SurR9-C84A-treated groups showed no significant difference for PI, indicating its neuroprotective potential. *P<0.05; **P<0.01. Data are represented as means ± standard deviation, n=3.
Abbreviations: NPs, nanoparticles; PE-A, propidium iodide signal.
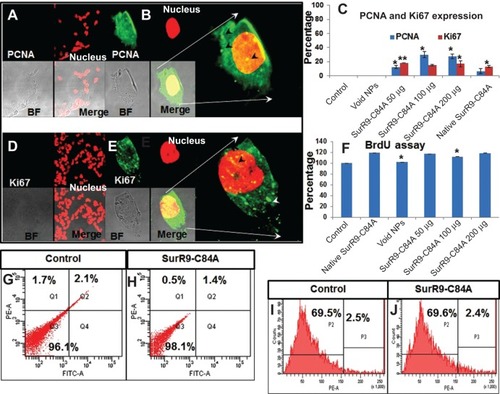
Figure 5 Gene-expression study in (A) undifferentiated and (B) differentiated SK-N-SH cells after SurR9-C84A treatment.
Notes: SurR9-C84A showed increased expression of apoptotic genes in undifferentiated cells, whereas a reduced expression of them was noticed in differentiated SK-N-SH cells. The relative expression of all the genes was measured and calculated relative to the housekeeping gene β-actin. Data are represented as means ± standard deviation of two independent experiments. (C) Gel images of gene expression in undifferentiated and (D) differentiated SK-N-SH cells. Lanes 1–6 are control, void, pure SurR9-C84A 75 μg, and SurR9-C84A-loaded NPs with 50, 100, and 200 μg treatments, respectively. *P<0.05; **P<0.01.
Abbreviation: NPs, nanoparticles.
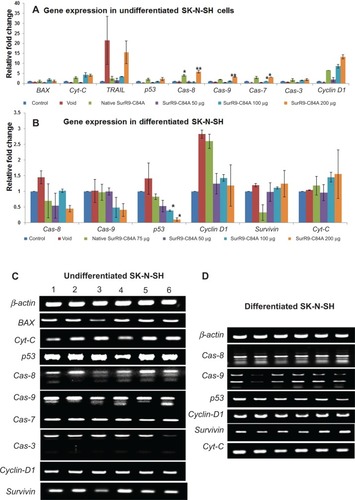
Table 3 Comparative protein expression in undifferentiated and differentiated SK-N-SH cells
Figure 6 Comparison of protein expression in the undifferentiated and differentiated SK-N-SH neurons.
Notes: (A) Protein expression in undifferentiated SK-N-SH after treatment with SurR9-C84A-loaded NPs. Compared with the untreated control, the proteins involved in cell-cycle progression, such as survivin, PCNA, Ki67, and β-tubulin, were downregulated, and the apoptotic markers BAX, Cyt-C, Cas-3, and p53 were upregulated after SurR9-C84A treatment. This confirmed the antitumor potential of SurR9-C84A. (B) SurR9-C84A increased the expression of cell-proliferation markers, such as β-tubulin, survivin, PCNA, and Ki67 in differentiated SK-N-SH cells, while indicators of apoptosis Cas-3, Cyt-C, and p53 showed reduced expression compared to the controls. Also, the differentiating marker β-tubulin III showed a slight reduction, indicating the preparatory changes toward proliferation.
Abbreviations: FITC, fluorescein isothiocyanate; NPs, nanoparticles; PCNA, proliferating cell nuclear antigen.
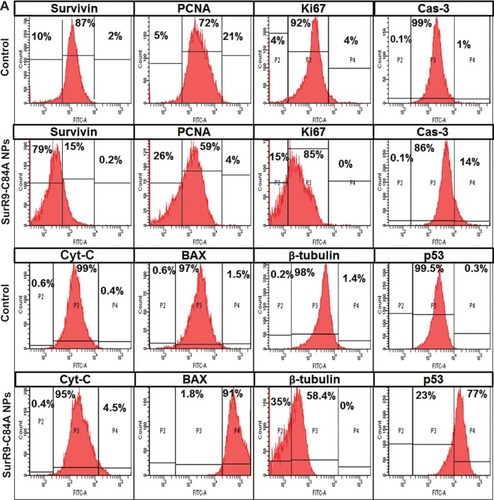
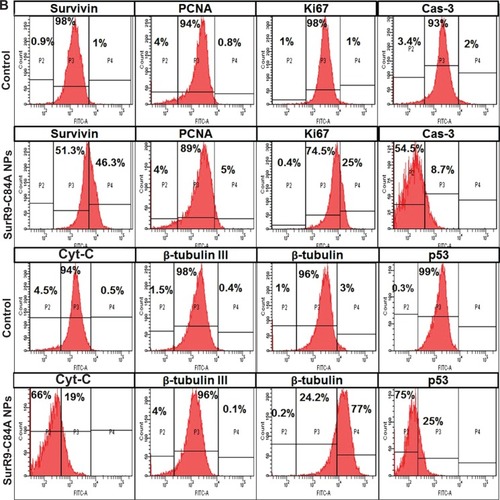
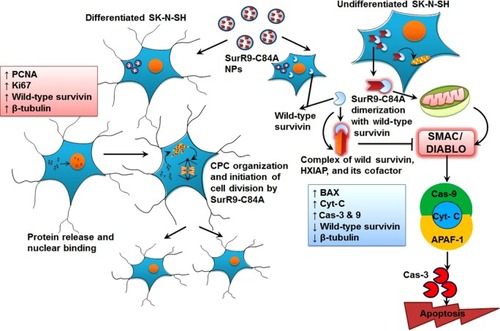
Figure 7 SurR9-C84A mechanism of action on undifferentiated and differentiated SK-N-SH cells.
Notes: In the case of undifferentiated cells, soon after the release of SurR9-C84A from the NPs, they dimerized with wild-type survivin and antagonized its function, leading to cell-cycle arrest. SurR9-C84A interfered with the formation of the survivin–SMAC/DIABLO complex, and thereby relieved survivin’s inhibitory effect on Cas-9 activity. Also, due to the unavailability of wild-type survivin, hepatitis B X-interacting protein (HXIAP) could not alone inhibit the activation of procaspase-9. Levels of BAX, Cyt-C and Cas-9 also increased, followed by activation of Cas-3, thus propagating mitochondria-mediated apoptosis. In the differentiated SK-N-SH cells, where there was a low endogenous pool of wild-type survivin, SurR9-C84A was able to interact with the microtubular assembly and initiate chromosome passenger-complex formation, and thus neuronal division was initiated. This was evident from the expression of proliferation markers PCNA and Ki67.
Abbreviations: NPs, nanoparticles; Cas-3, Caspase-3; CPC, chromosome passenger complex; SMAC/DIABLO, second mitochondria-derived activator of caspases and direct IAP-binding protein with low PI; APAF1, apoptotic protease activating factor 1; PCNA, proliferating cell nuclear antigen.