Figures & data
Figure 1 Illustration representing the drug-adsorbed mesoporous silica nanoparticles (doxorubicin-MSN) encapsulated into RGD-containing peptide functionalized alginate microspheres.
Abbreviations: MSNs, mesoporous silica nanoparticles; MSN@Alg, MSNs and organic alginate; RGD, arginine-glycine-aspartic acid.
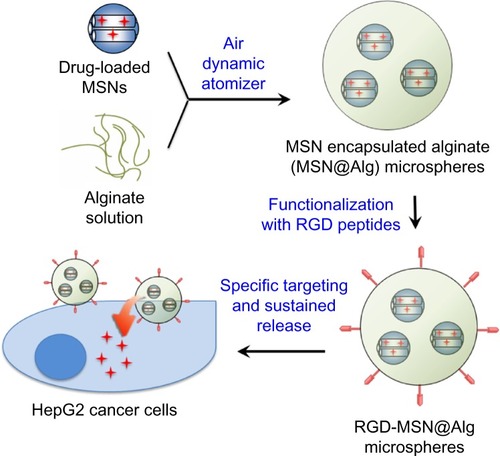
Figure 2 (a) Typical scanning electron microscopy image of mesoporous silica nanoparticles (MSNs) used in this study, with (a-1) spherical morphology and (a-2) bulk-like morphology. (b) A typical optical microscopy image of alginate microspheres. (c) Fluorescent images of a fluorescein isothiocyanate-MSN-encapsulated alginate microsphere: (c-1) DIC image, (c-2) green fluorescent image from fluorescein isothiocyanate-adsorbed MSNs, and (c-3) merged image.
Abbreviation: DIC, differential interference contrast microscopy.
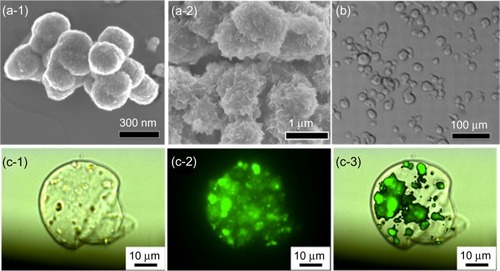
Figure 3 (A) Fourier transform infrared spectroscopy and (B) UV-Vis spectroscopy of samples including pure alginate microspheres, pure K4YRGD peptides, and K4YRGD peptide-functionalized alginate microspheres. Alg represents alginate.
Abbreviations: Alg, alginate microparticle; UV-Vis, ultraviolet–visible; RGD, arginine-glycine-aspartic acid.
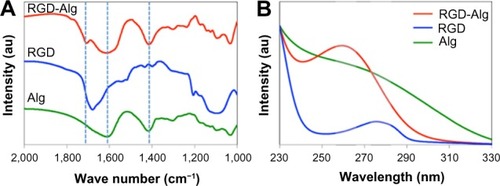
Figure 4 Release profiles of Rhodamine 6G-adsorbed mesoporous silica nanoparticle-encapsulated alginate microspheres in (A) different concentrations of alginate and (B) different concentrations of phosphate-buffered saline.
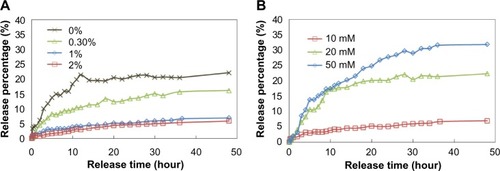
Figure 5 Confocal microscopy images of liver cancer cells (HepG2) treated with fluorescein isothiocyanate-labeled mesoporous silica nanoparticle-encapsulated alginate microspheres (a) with and (b) without K4YRGD peptides. (a-1 and b-1) Merged images. (a-2 and b-2) DIC images. (a-3 and b-3) Blue fluorescent images from DAPI-stained nuclei. (a-4 and b-4) Green fluorescent images from fluorescein isothiocyanate-labeled MSNs.
Abbreviations: DAPI, 4′,6-diamidino-2-phenylindole; DIC, differential interference contrast microscopy; MSNs, mesoporous silica nanoparticles.
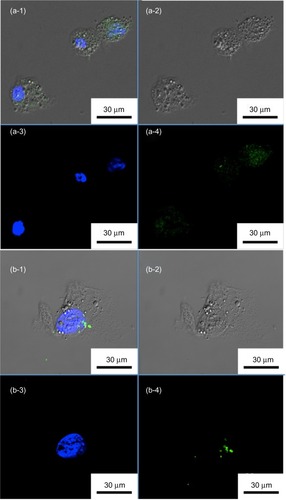
Figure 6 (A) Uptake amounts of samples with and without K4YRGD peptides in HepG2 cells. (B) Uptake amounts of fluorescein isothiocyanate-labeled mesoporous silica nanoparticle-encapsulated alginate with K4YRGD peptides with and without the presence of sucrose.
Abbreviations: FITC, fluorescein isothiocyanate; MSN@Alg, MSNs and organic alginate.
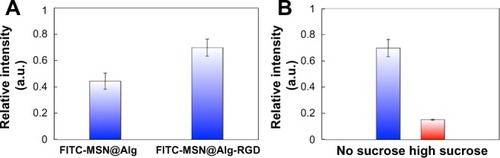
Figure 7 (A) MTT assays of normal cells (3T3) and cancer cells (HepG2) treated with fluorescein isothiocyanate-labeled mesoporous silica nanoparticle-encapsulated alginate (MSN@Alg) with different concentrations. (B) MTT assays of HepG2 cells treated with doxorubicin-loaded MSN@Alg microspheres with and without K4YRGD peptides.
Abbreviations: MTT, 3-[4,5-dimethylthiazol-2-yl]-2,5 diphenyl tetrazolium bromide; DOX, doxorubicin.
![Figure 7 (A) MTT assays of normal cells (3T3) and cancer cells (HepG2) treated with fluorescein isothiocyanate-labeled mesoporous silica nanoparticle-encapsulated alginate (MSN@Alg) with different concentrations. (B) MTT assays of HepG2 cells treated with doxorubicin-loaded MSN@Alg microspheres with and without K4YRGD peptides.Abbreviations: MTT, 3-[4,5-dimethylthiazol-2-yl]-2,5 diphenyl tetrazolium bromide; DOX, doxorubicin.](/cms/asset/9ea7efd1-8b89-4cd7-b1cc-da44fc9b7c81/dijn_a_60171_f0007_c.jpg)
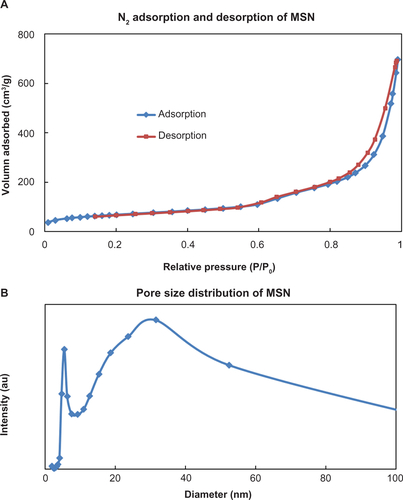
Figure S1 (A) N2 adsorption and desorption of mesoporous silica nanoparticles (MSNs). The surface area of MSNs calculated from the BET model was around 285 m2/g. (B) The pore size distribution of MSN. The pore sizes of MSN calculated for the BJH model were 5 and 30 nm, respectively.
Abbreviations: BET, Brunauer–Emmett–Teller; BJH, Barret-Joyner-Halenda.