Figures & data
Figure 1 Fabrication of BMP-2-producing cell sheet and surgical schematic. (A) A schematic presentation of the fabrication procedure for the cell sheet and the surgical procedure. (B) Cultured BMSCs were lifted as a cell sheet using a scraper. (C) The cell sheet was folded to adapt the shape of the calvarial defect. (D) Two 5 mm diameter defects were prepared at the calvarial area of a rat, and the cell sheet was transplanted into the defect.
Abbreviations: BMSCs, bone marrow mesenchymal stem cells; PEI–al/pBMP-2, polyethylenimine–alginate/plasmid of bone morphogenetic protein 2; BMP-2, bone morphogenetic protein 2.
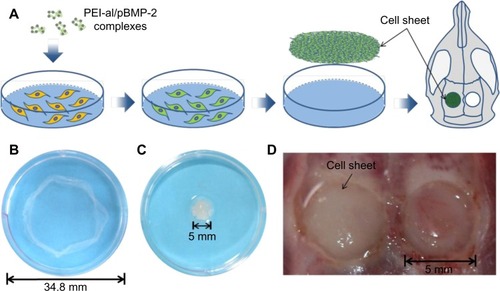
Table 1 Physical characteristics of PEI–al nanocomposites, BMP-2 plasmid, and PEI–al/pBMP-2 complexes
Figure 2 Physicochemical characterization of the PEI–al nanocomposites and PEI–al/pBMP-2 complexes. (A) SEM images of PEI–al nanocomposites. (B) SEM images of PEI–al/pBMP-2 complexes. Red arrows indicate PEI–al/pBMP-2 complexes. (C) TEM images of PEI–al nanocomposites. (D) TEM images of PEI–al/pBMP-2 complexes. Red arrows indicate PEI–al/pBMP-2 complexes. (E) FTIR spectra of PEI–al nanocomposites, PEI, and alginate. (F) Agarose gel electrophoresis retardation assay of PEI–al/pBMP-2 at various w/w ratios of 0.5:1, 1:1, 1.5:1, 2:1, 3:1, and 4:1.
Abbreviations: FTIR, Fourier transform infrared; PEI–al/pBMP-2, polyethylenimine–alginate/plasmid of bone morphogenetic protein 2; SEM, scanning electron microscopy; TEM, transmission electron microscopy; w/w ratios, weight ratios; PEI–al, polyethylenimine–alginate; PEI, polyethylenimine.
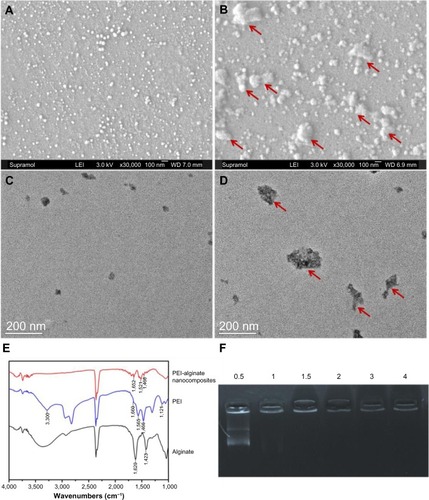
Figure 3 Evaluation of properties of PEI–al/pDNA on BMSCs in vitro. (A) Fluorescent microscopy images of BMSCs transfected with PEI/pEGFP and PEI–al/pEGFP complexes at different w/w ratios of nanocomposites/pEGFP. Bright field of BMSCs (A-1, A-2 and A-3) EGFP expression in BMSCs transfected by PEI/pEGFP (w/w =1:1) and PEI–al/pEGFP (w/w =2:1 and 3:1) complexes. Magnification of all images is 200×. (B) Cell viability of PEI/pBMP-2 and PEI–al/pBMP-2 complexes at various w/w ratios of 0, 0.5:1, 1:1, 2:1, and 3:1 transfected to BMSCs. (C) Release of human BMP-2 protein from PEI–al/pBMP-2 (w/w =3:1) transfected BMSCs on days 2, 4, 8, and 14.
Notes: *P<0.05; **P<0.01.
Abbreviations: BMSCs, bone marrow mesenchymal stem cells; pBMP-2, plasmid of bone morphogenetic protein 2; pEGFP, plasmid of enhanced green fluorescent protein; PEI–al/pDNA, polyethylenimine–alginate/plasmid DNA; w/w, weight ratios; EGFP, enhanced green fluorescent protein; PEI, polyethylenimine; BMP-2, bone morphogenetic protein 2.
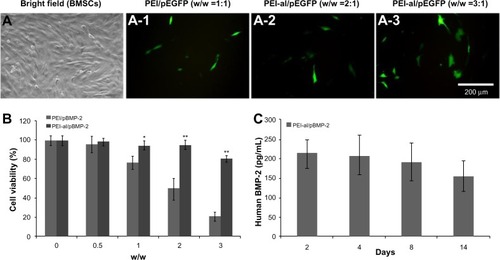
Figure 4 Expression of specific osteogenic genes (COLL I, SP7, RUNX2, ALP) of BMSCs evaluated by qPCR at 3, 7, and 14 days post-transfection with PEI–al/pEGFP and PEI–al/pBMP-2 complexes. (A) 3 days post-transfection. (B) 7 days post-transfection. (C) 14 days post-transfection.
Notes: *P<0.05; **P<0.01.
Abbreviations: ALP, alkaline phosphatase; COLL I, I type collagen; pBMP-2, plasmid of bone morphogenetic protein 2; PEI–al/pEGFP, polyethylenimine–alginate/plasmid of enhanced green fluorescent protein; qPCR, real-time quantitative polymerase chain reaction; RUNX2, runt-related transcription factor 2; SP7, Osterix; BMSCs, bone marrow mesenchymal stem cells.
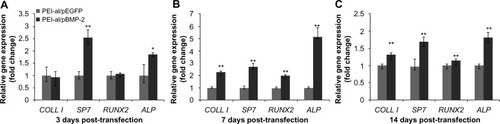
Figure 5 Microcomputed tomography images of rat cranial bone and quantification after 4 or 8 weeks post-implantation. (A) Blank control group after 4 weeks. (B) EGFP/CS group after 4 weeks. (C) BMP/CS group after 4 weeks. (D) Blank control group after 8 weeks. (E) EGFP/CS group after 8 weeks. (F) BMP/CS group after 8 weeks. (G) Quantification of new bone area.
Notes: *P<0.05; **P<0.01.
Abbreviations: BMP/CS, bone morphogenetic protein 2 gene-modified cell sheet; EGFP/CS, enhanced green fluorescent protein gene-modified cell sheet.
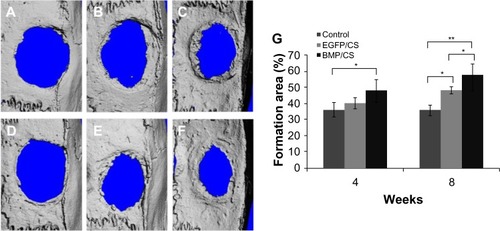
Figure 6 Hematoxylin and eosin staining of rat cranial defect after 4 or 8 weeks post-implantation. (A) Blank control group after 4 weeks (×20). (B) Blank control group after 8 weeks (×20). (C) EGFP/CS group after 4 weeks (×20). (D) EGFP/CS group after 8 weeks (×20). (E) BMP/CS group after 4 weeks (×20). (F) BMP/CS group after 8 weeks (×20). (G) Enlarged image of the edge of the defect in EGFP/CS group after 4 weeks (×400). (H) Enlarged image of the edge of the defect in BMP/CS group after 4 weeks (×400). Black arrows indicate the edge of the defect, and green arrows indicate osteoblasts.
Abbreviations: BMP/CS, bone morphogenetic protein 2 gene-modified cell sheet; EGFP/CS, enhanced green fluorescent protein gene-modified cell sheet.
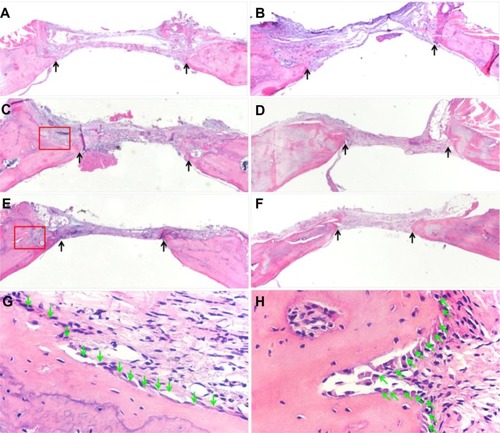
Table 2 Hematology parameters of rats treated with CS and BMP/CS at 1, 3, and 7 days after surgery
Table 3 Serum biochemical parameters of rats treated with CS and BMP/CS at 1, 3, 7 days after surgery
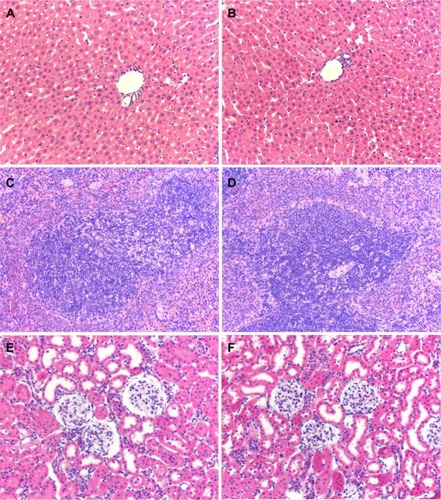
Figure 7 Hematoxylin and eosin staining of liver, spleen, and kidney from rats treated with CS and BMP/CS at 7 days after surgery. (A) Liver of CS group (×200). (B) Liver of BMP/CS group (×200). (C) Spleen of CS group (×200). (D) Spleen of BMP/CS group (×200). (E) Kidney of CS group (×200). (F) Kidney of BMP/CS group (×200).
Abbreviations: BMP/CS, bone morphogenetic protein 2 gene-modified cell sheet; CS, cell sheet.