Figures & data
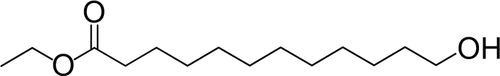
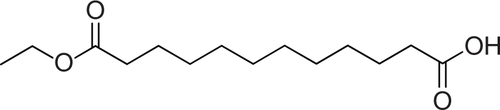
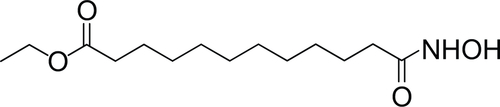
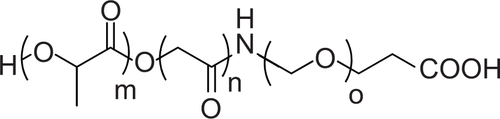
Figure 1 Schematic representation of all the major steps for synthesis of Fe3O4-1-PNPs-hEGFR-99m Tc. Structures of the ligand ethyl 12-(hydroxyamino)-12-oxododecanoate 1 and PLGA-b-PEG-COOH copolymer are reported in the blue frame.
Abbreviations: PLGA, poly(D,L-lactide-co-glycolide); hEGFR, human epidermal growth factor receptor; PNPs, polymeric nanoparticles; PEG, poly(ethylene glycol).
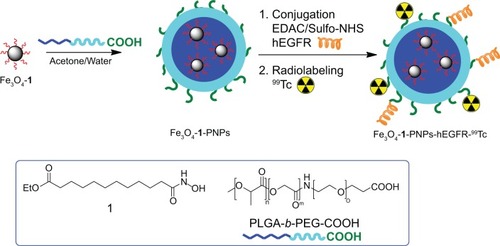
Figure 2 Transmission electron micrographs of (A) Fe3O4-1-PNPs (scale bar, 100 nm) and (B) Fe3O4-1-PNP-hEGFR (bar scale, 100 nm). In both the images, aggregates of iron oxide nanoparticles into spherical-shaped larger carriers (PNPs) can be seen.
Abbreviations: hEGFR, human epidermal growth factor receptor; PNPs, polymeric nanoparticles.
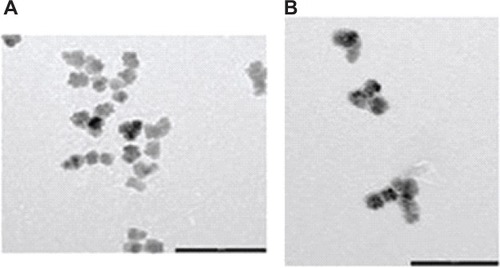
Figure 3 Scintigraphic image of hybrid radiolabeled Fe3O4-1-PNP-hEGFR-99mTc in an A431 tumor-bearing SCID mouse model. The tumor site is clearly visible, indicating accumulation of the nanosystems.
Abbreviations: hEGFR, human epidermal growth factor receptor; PNP, polymeric nanoparticles; SCID, severe combined immunodeficiency.
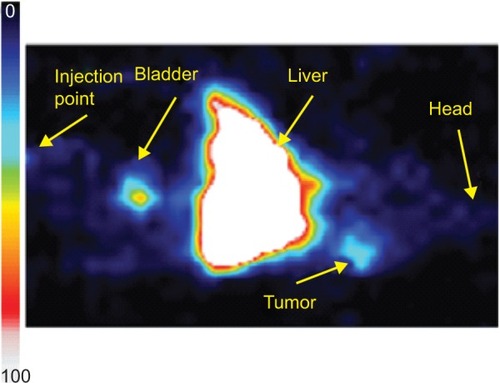
Figure 4 Monitoring of whole body temperature in a mouse placed inside the inductive coil of the hyperthermia system using a FLIR infrared camera at day 22.
Notes: Increased outer temperature is evident in the tumor region (A). Temperature increase in the tumor, head, liver, and mouse bladder during the hyperthermia session (B). ThermaCAM™ E300 (FLIR) (FLIR Systems Inc., Meer, Belgium).
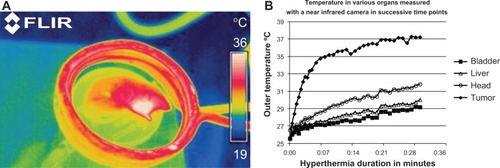
Figure 5 Temperature increase at the tumor region in the second mouse in the third group for all hyperthermia sessions (A). Tumor volume in the same mouse on day 12 through day 24, showing a decrease in tumor volume (B).
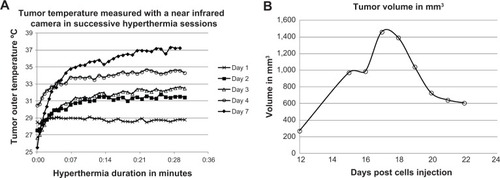
Figure S1 X-ray diffraction pattern of the Fe3O4 dispersion sample.
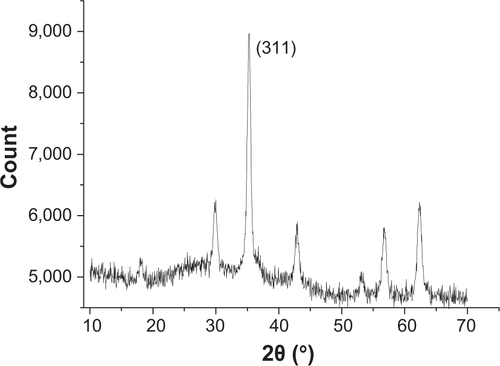
Figure S2 Log-normal size distribution of Fe3O4 by dynamic light scattering.
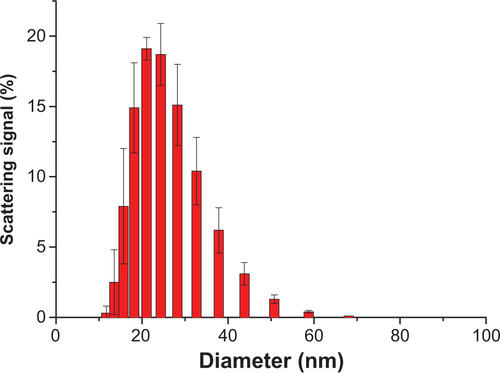
Figure S3 Transmission electron micrograph of magnetite dispersion (image obtained courtesy of a collaboration with the Laboratoire de Chimie des Polymères Organiques Bordeaux in the framework of the European Project NANOTHER, 7wp). Scale bar, 50 nm.
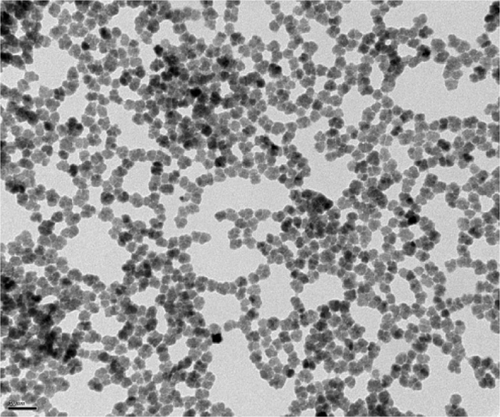
Figure S4 Magnetic characterization of the inorganic core of iron oxide (Fe3O4) nanoparticles.
Notes: (A) Zero field-cooling/field-cooling magnetization curves performed with a 50 Oe probe field and (B) magnetization curves at low (2.5 K) and room (300 K) temperature. Low field range details are shown in the inset.
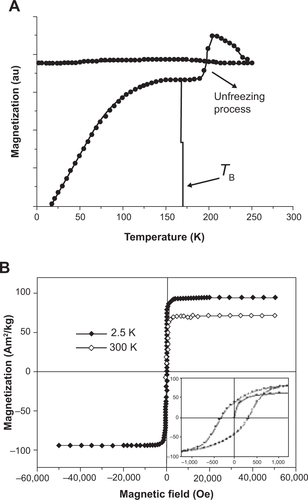
Figure S5 Log-normal size distribution of Fe3O4-1 by dynamic light scattering.
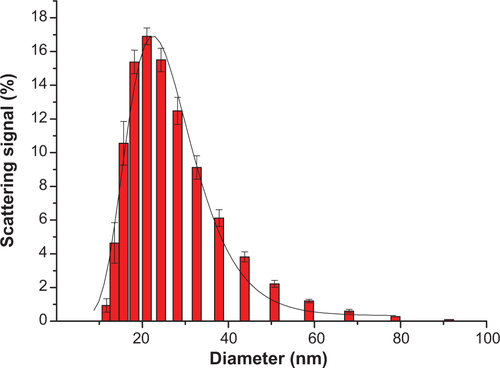
Figure S6 Infrared analysis of Fe3O4-1.
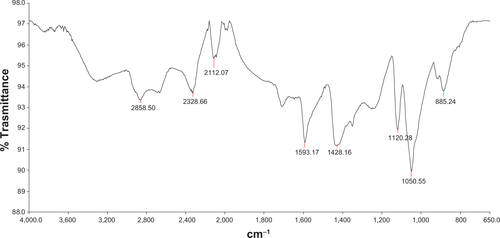
Figure S7 Log-normal size distribution by dynamic light scattering (A) and analysis of zeta potential for Fe3O4-1-PNPs (B).
Abbreviation: PNPs, polymeric nanoparticles.
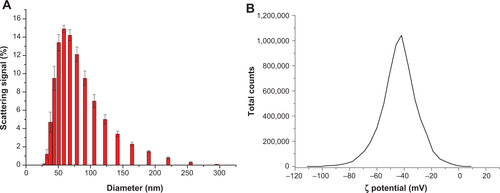
Figure S8 (A) Transmission electron micrographs and (B) scanning transmission electron micrograph of Fe3O4-1-PNPs. Scale bar, 100 nm.
Abbreviation: PNPs, polymeric nanoparticles.
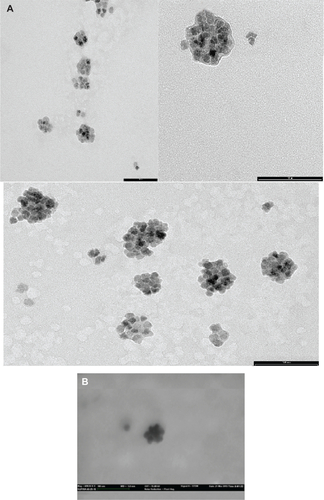
Figure S9 Log-normal size distribution by dynamic light scattering (A) and analysis of zeta potential of Fe3O4-1-PNPs-hEGFR (B).
Abbreviations: hEGFR, human epidermal growth factor; PNPs, polymeric nanoparticles.
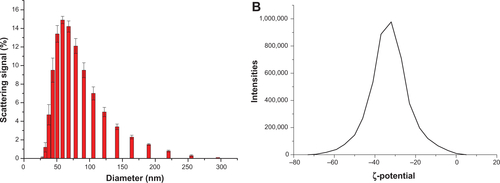
Figure S10 Comparison of the magnetization curve of the inorganic core and those of the hybrid nanoparticles functionalized by hEGFR and then radiolabeled by 99Tc. The curves are collected at low temperature (2.5 K) and normalized to the corresponding saturation magnetization.
Abbreviations: hEGFR, human epidermal growth factor receptor; PNPs, polymeric nanoparticles.
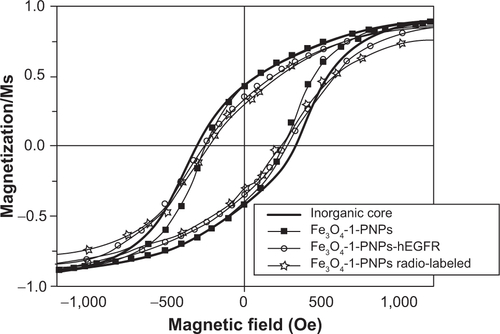
Figure S11 Check for overexpression of epidermal growth factor receptor in Jurkat, MDA-MB-231, and A431 cell lines.
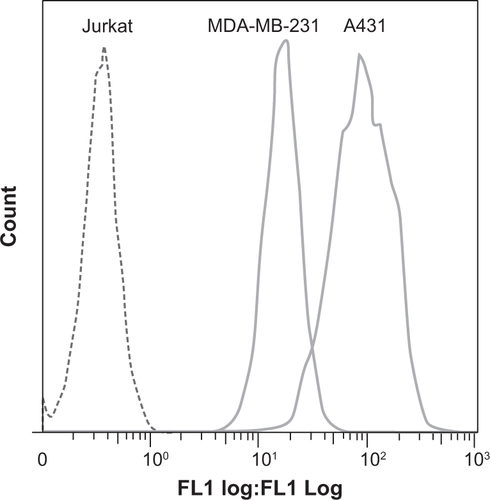
Figure S12 Electrophoresis analysis of the purified antibody.
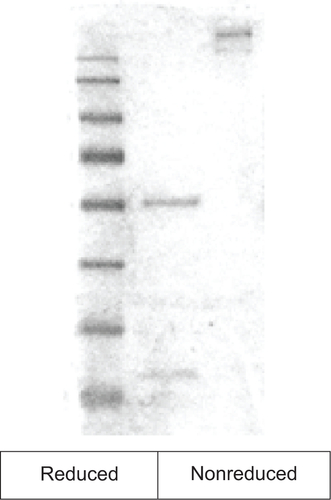
Figure S13 Determination of the monoclonal antibody attached to the hybrid nanoparticles.
Abbreviations: hEGFR, human epidermal growth factor receptor; PNPs, polymeric nanoparticles; Abs, absorbance.
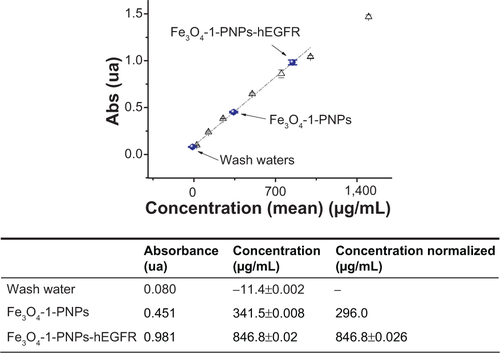
Figure S14 Instant thin layer chromatography silica gel results showing the intact Fe3O4-1-PNPs-hEGFR-99mTc- following DTPA, His, and serum stability studies after incubation at 37°C.
Abbreviations: hEGFR, human epidermal growth factor receptor; PNPs, polymeric nanoparticles; DTPA, pentetic acid.
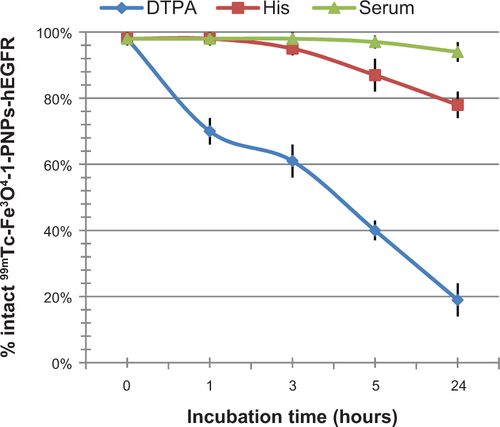
Figure S15 Biodistribution of Fe3O4-1-PNPs-hEGFR-99mTc in tumor-bearing mice (n=3) (A) and Fe3O4-1-PNPs-99mTc (B).
Abbreviations: hEGFR, human epidermal growth factor receptor; PNPs, polymeric nanoparticles; ID, injected dose.
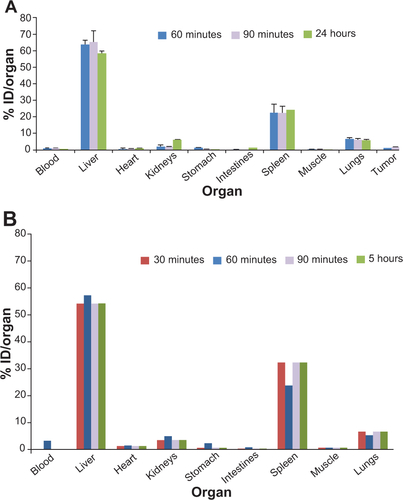
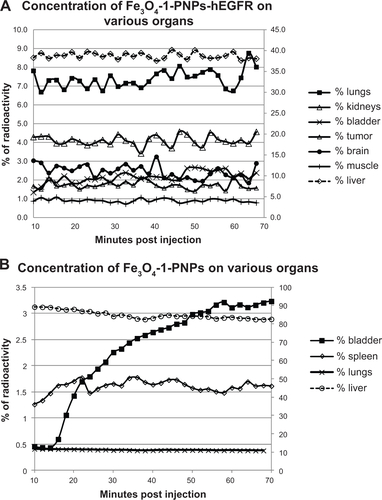
Figure S16 Percentage of radioactivity concentration using regions of interest in liver, muscle, brain, tumor, bladder, kidneys, and lungs in a dynamic study of Fe3O4-1-PNPs-hEGFR-99mTc in an A431 tumor-bearing mouse (A). Similar analysis in a normal mouse injected with Fe3O4-1-PNPs-99mTc (B). Regions of interest were applied on successive 2-minute frames. The liver is plotted on a secondary axis.
Abbreviations: hEGFR, human epidermal growth factor receptor; PNPs, polymeric nanoparticles.