Figures & data
Figure 1 Schematic drawing of the positively charged AmS-IONPs and negatively charged EDT-IONPs and their physical properties.
Notes: Measurements were performed in triplicate samples, using a Nanopartica SZ-100 Series Instrument from Horiba (Horiba Instruments Inc., Irvine, CA, USA). Values represent the mean ± standard error of the mean (n=3).
Abbreviations: AmS-IONPs, aminosilane-coated iron oxide nanoparticles; EDT-IONPs, N-(trimethoxysilylpropyl)ethylenediaminetriacetate-coated iron oxide nanoparticles.
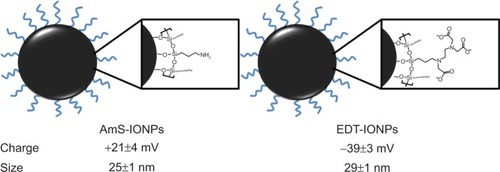
Table 1 Permeability coefficient obtained in blank membrane, intact, and disrupted BBB model for paracellular marker FDX-70,000 MWT, AmS-IONPs, and EDT-IONPs with or without magnet
Figure 2 Permeability of FDX-70,000 and IONPs in confluent bEnd.3 cell monolayers in the presence and absence of a magnetic field. FDX-70,000 flux was determined in control monolayers and monolayers treated with AmS-IONPs (A) and EDT-IONPs (C). The permeability of AmS-IONPs (B) and EDT-IONPs (D) was determined at 8 and 24 hours.
Notes: Quantitative determination of IONP permeability was based on the amount of Fe in a basolateral compartment divided by the amount of Fe loaded in an apical compartment and recorded as a percentage. Values represent the mean ± standard error of the mean of three samples per treatment group.
Abbreviations: AmS-IONPs, aminosilane-coated iron oxide nanoparticles; EDT-IONPs, N-(trimethoxysilylpropyl)ethylenediaminetriacetate-coated iron oxide nanoparticles; FDX, fluorescein-labeled dextran; BDL, below detection limit.
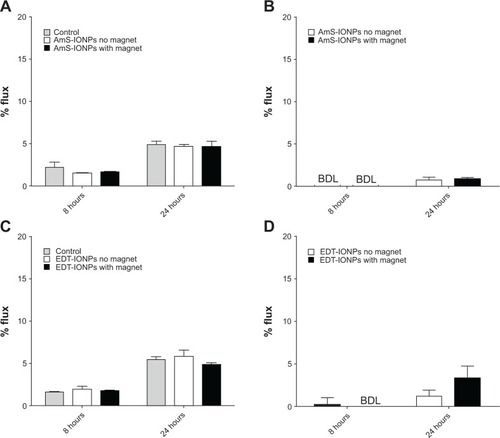
Figure 3 Permeability of fluorescein-labeled dextran-70,000 and IONPs across osmotically disrupted bEnd.3 cell monolayers in the presence and absence of a magnetic field. Fluorescein-labeled dextran-70,000 flux was determined in control monolayers and monolayers treated with AmS-IONPs (A) and EDT-IONPs (C). The permeability of AmS-IONPs (B) and EDT-IONPs (D) was determined at 8 and 24 hours.
Notes: Quantitative determination of IONP permeability was based on the amount of Fe in a basolateral compartment over the amount of Fe loaded in an apical compartment expressed as a percentage. Values represent the mean ± standard error of the mean of three samples per treatment group. **P<0.01 compared with the same treatment group but without magnetic field.
Abbreviations: AmS-IONPs, aminosilane-coated iron oxide nanoparticles; EDT-IONPs, N-(trimethoxysilylpropyl)ethylenediaminetriacetate-coated iron oxide nanoparticles; IONPs, iron oxide nanoparticles.
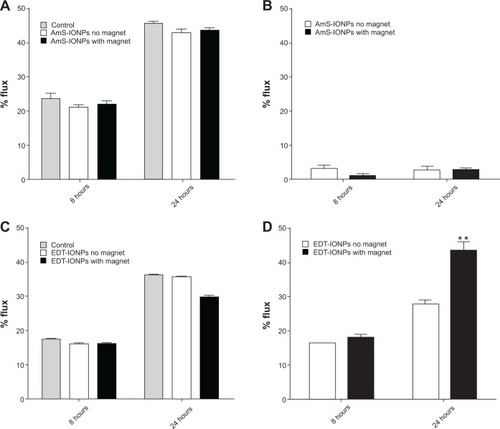
Figure 4 Permeability of aminosilane-coated-iron oxide nanoparticles and N-(trimethoxysilylpropyl)ethylenediaminetriacetate-iron oxide nanoparticles across blank membrane inserts (A) and compared with nanoparticle permeability in a disrupted model of the blood–brain barrier (B).
Note: Values represent the mean ± standard error of the mean of three samples per treatment group.
Abbreviations: AmS-IONPs, aminosilane-coated iron oxide nanoparticles; EDT-IONPs, N-(trimethoxysilylpropyl)ethylenediaminetriacetate-coated iron oxide nanoparticles; IONP, iron oxide nanoparticle; BBB, blood–brain barrier.
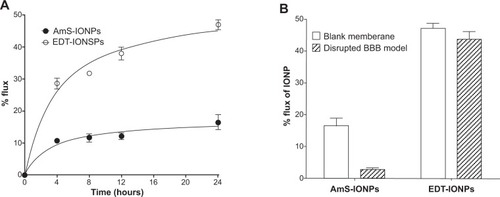
Figure 5 ACFs obtained by photon correlation spectroscopy for AmS-IONPs (top) and EDT-IONPs (bottom) in water at a scattering angle of 90 degrees.
Notes: Symbols indicate time of measurement after suspension. Correlation at larger time scales is indicative of the presence of second, aggregated size distribution, as seen only in the AmS-IONPs.
Abbreviations: ACF, autocorrelation function; AmS-IONPs, aminosilane-coated iron oxide nanoparticles; EDT-IONPs, N-(trimethoxysilylpropyl)ethylenediaminetriacetate-coated iron oxide nanoparticles; PCS, photo correlation spectroscopy.
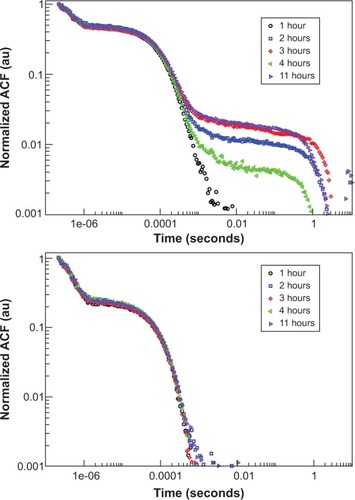
Figure 6 Contributions to the scattered light intensity from AmS-coated nanoparticles (top) and nanoparticle aggregate population (bottom) in water with physiological pH as a function of time from sample preparation.
Notes: Scattering intensities are reported as the ratio of scattered light from a particular population to the total scattered light intensity. An increase in the relative population of aggregates is observed at small times (<3 hours). The aggregates continue to grow in size past the point of stability and fall out of suspension, no longer contributing to the scattered light intensity.
Abbreviation: AmS, aminosilane.
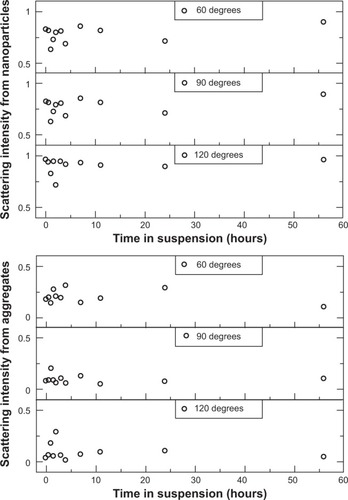
Figure 7 Cell accumulation of AmS-IONPs in the absence (A) and presence (B) of a magnetic field as well as EDT-IONPs uptake in the absence (C) and presence (D) of a magnetic field.
Notes: Values represent the mean ± standard error of the mean of three samples per treatment group. No significant difference was found between the D-mannitol treated and the control group.
Abbreviations: AmS-IONPs, aminosilane-coated iron oxide nanoparticles; EDT-IONPs, N-(trimethoxysilylpropyl)ethylenediaminetriacetate-coated iron oxide nanoparticles.
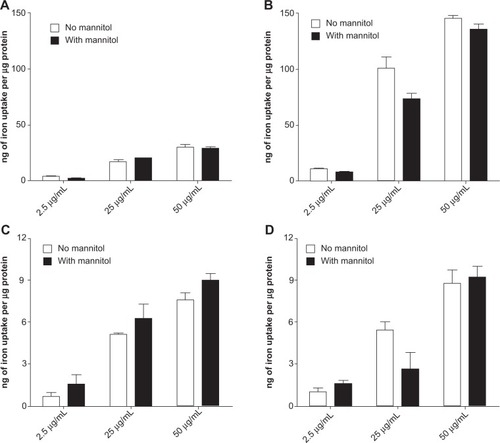
Figure S1 Transmission electron microscopy image of N-(trimethoxysilylpropyl)ethylenediaminetriacetate-iron oxide nanoparticles. Inset shows selected area electron diffraction pattern of these particles.
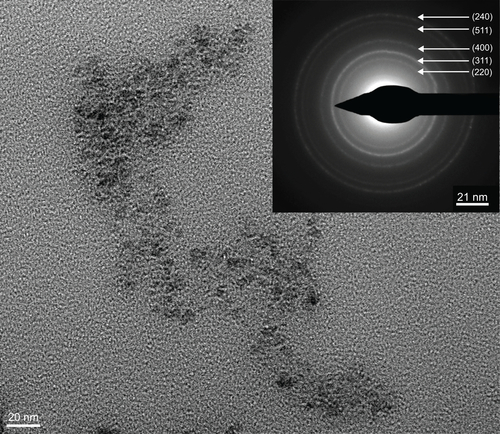
Figure S2 Thermal gravimetric analysis plot for N-(trimethoxysilylpropyl)ethylene diaminetriacetate-iron oxide nanoparticles showing approximately 49% weight loss after desorption of water.
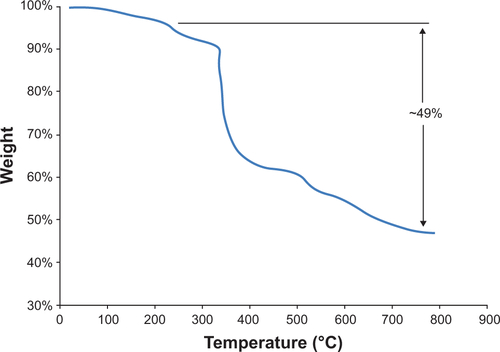
Figure S3 Fourier transform infrared spectroscopy spectrum of N-(trimethoxysilylpropyl)ethylenediaminetriacetate-iron oxide nanoparticles.
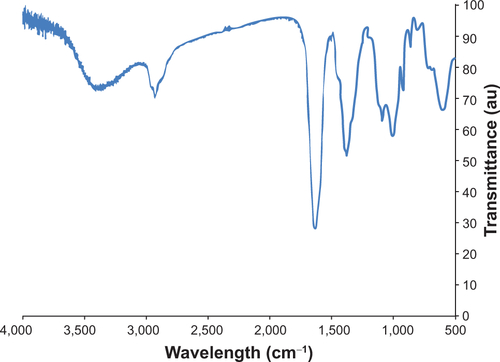
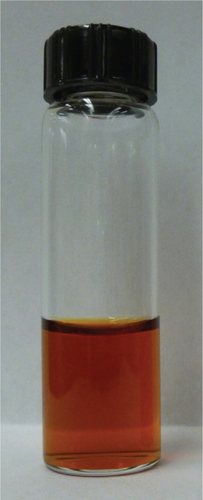
Figure S4 Picture of a dispersion of N-(trimethoxysilylpropyl)ethylenediaminetriacetate-iron oxide nanoparticles in water.