Figures & data
Table 1 Compartmental pharmacokinetic parameters of sum total CPT-11 after IHL-305 in patients with linear and nonlinear disposition
Figure 1 Relationship between the ratio of TBW/IBW and dose-normalized IHL-305 sum total AUC (AUC/dose). AUC/dose in patients aged <60 and ≥60 years are represented by the solid triangles and open triangles, respectively.
Notes: The best-fit line of the data is represented by the curved solid line (R2=0.12). After controlling for age, there was an inverse relationship between TBW/IBW and AUC/dose, with a low TBW/IBW being associated with high AUC/dose in patients aged <60 years; CPT-11 is irinotecan; IHL-305 is a PEGylated liposomal formulation of irinotecan.
Abbreviations: AUC, area under the concentration versus time curve; TBW/IBW, total body weight to ideal body weight.
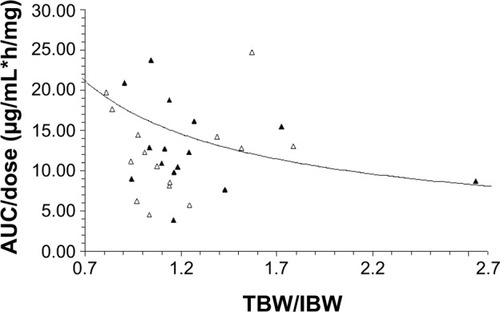
Figure 2 Relationship between two factors, age, and the ratio of TBW/IBW, and ratio of released CPT-11 AUC to sum total CPT-11 AUC.
Notes: Patients are divided into four groups according to the median value of age and TBW/IBW. The size of each circle correlates with ratio of released CPT-11 AUC to sum total CPT-11 AUC in a patient at the specific age and ratio of true body weight to ideal body weight. The mean ± standard deviation values for the ratio of released CPT-11 AUC to sum total CPT-11 AUC were 0.0042±0.0028, 0.0038±0.0038, 0.0066±0.0084, and 0.0025±0.0013 in patients aged <60 years and TBW/IBW <1.16, patients aged ≥60 years and TBW/IBW <1.16, patients aged ≥60 years and TBW/IBW ≥1.16, and patients aged <60 years and TBW/IBW ≥1.16, respectively; CPT-11 is irinotecan; IHL-305 is a PEGylated liposomal formulation of irinotecan.
Abbreviations: AUC, area under the concentration versus time curve; TBW/IBW, total body weight to ideal body weight.
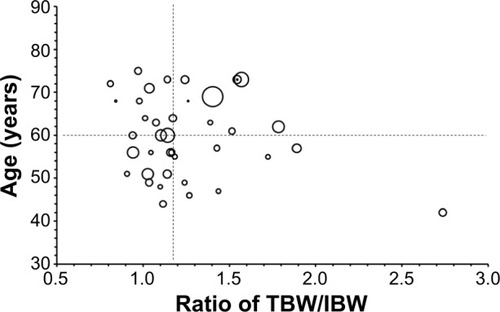
Figure 3 Relationship between percent decrease in monocytes and dose normalized CPT-11 AUC (AUC/dose).
Notes: (A, B) Represent the relationship between percent decrease in monocytes and AUC/dose in patients with linear clearance and nonlinear clearance, respectively. The relationship between AUC/dose and percent decrease in monocytes was best described by a linear relationship in patients with linear clearance (P=0.008, y = −0.108x +14.7, R2=0.49); CPT-11 is irinotecan; IHL-305 is a PEGylated liposomal formulation of irinotecan.
Abbreviation: AUC, area under the concentration versus time curve.
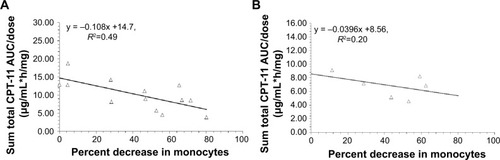
Table 2 Summary of ANC and monocyte decrease at nadir after administration of IHL-305
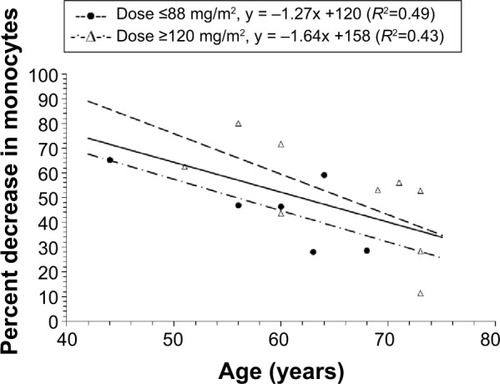
Figure 4 Relationship between percent decrease in monocytes and age in all patients with a dose ≥50 mg/m2.
Notes: For patients with a dose ≥50 mg/m2 and ≤88 mg/m2, individual values are represented by the solid circles. For patients with a dose ≥120 mg/m2, individual values are represented by the open triangles. There was a linear relationship between the percent decrease in monocytes and age in all patients (R2=0.32), patients with a dose ≤88 mg/m2 (R2=0.49), and in patients with a dose ≥120 mg/m2 (R2=0.43); CPT-11 is irinotecan; IHL-305 is a PEGylated liposomal formulation of irinotecan.