
Figures & data
Table 1 Groups and meshes used
Figure 1A, B Full-layer repaired abdominal wall for biomechanical and histological analyses.
Notes: (A) Incision of abdominal wall closed with polypropylene mesh; (B) incision of abdominal wall closed with simple suture. White boxes correspond to the samples of biomechanical analysis.
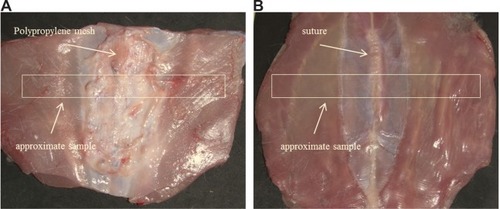
Figure 2 Tensiometer branches with anchored samples during biomechanical analyses.
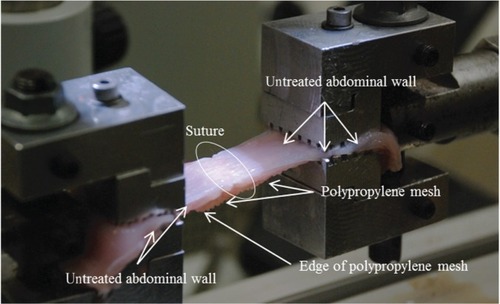
Figure 3A–F Video-recorded biomechanical assay (tensile strength).
Notes: (A) Simple suture tears in the line. (B) Healthy muscle broke at the edge, and the PP mesh slid on the top of the muscle. (C) Tissue treated by a PP mesh functionalized with PCL nanofibers enriched with adhered GF tore at the edge of the mesh and healthy muscle, and the slide was localized between muscle fibers. (D) In some PCL-nanofiber samples with adhered GF, the suture line tore first, but in others a tear occurred between muscle fibers or at the edge of the muscle and the mesh. (E) Healthy muscle tore at the edge, and a PP mesh functionalized with PCL nanofibers slid on top of the muscle, or the tear was localized not between the mesh and the muscle layer but in between muscle fibers. (F) In some PCL-nanofiber samples, the suture line tore first, but in others a tear occurred between muscle fibers or at the edge of the muscle and the mesh. White circles indicate areas of regenerated incision.
Abbreviations: PP, polypropylene; PCL, poly-ε-caprolactone; GF, growth factor.
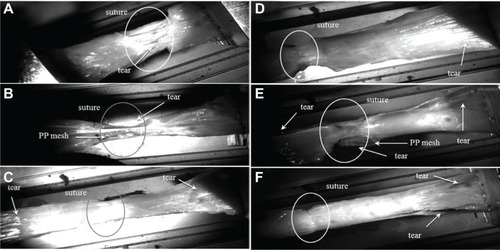
Table 2 Primary antibodies used for immunohistochemistry
Figure 4A–C Histological quantification.
Notes: (A) In sections stained with Verhoeff’s hematoxylin (Merck KGaA, Darmstadt, Germany) and green trichrome (DiaPath, Martinengo, Italy), the area fraction of collagen (stained green), adipose tissue, and granulomatous infiltrates (red arrow) was quantified. The area occupied by dissolved tissue scaffolds (asterisk) or by artificial microcracks (black arrow) was excluded from the reference area. Magnification 100×, scale bar 200 μm. (B) For all area quantifications, stereological point grids were superimposed on histological micrographs, points striking the structures of interest within the total area were counted, and the sum of these points was multiplied by the area corresponding to each point (marked “a” within the square). This is illustrated in an immunohistochemical section showing α-smooth-muscle actin-positive vascular smooth-muscle cells (yellow arrow) and myofibroblasts (green arrow). Magnification 200×, scale bar 100 μm. (C) Counting CD31-positive microvessel profiles per section area using projection of an unbiased counting frame consisting of two admittance borders (green) and two forbidden borders (red). Magnification 200×, scale bar 100 μm. Counterstaining Gill’s hematoxylin (Dr Kulich Pharma, Otrokovice, Czech Republic) (B, C).
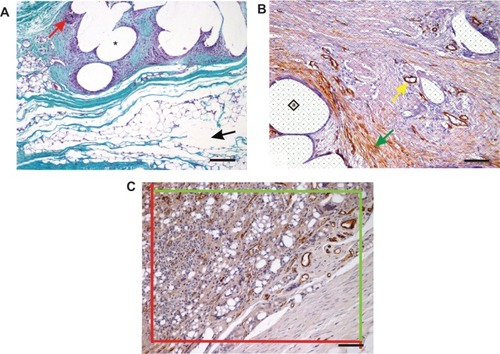
Figure 5A–C Scanning electron microscopy of the implanted scaffolds.
Notes: (A) PCL nanofibers (magnification 230×); (B) PP mesh (magnification 18×); (C) PP mesh functionalized with PCL nanofibers (magnification 18×).
Abbreviations: PP, polypropylene; PCL, poly-ε-caprolactone.
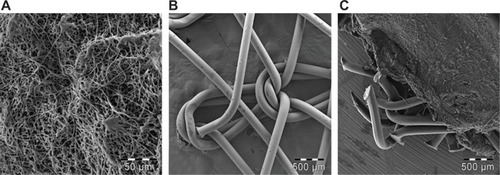
Figure 6 Metabolic activity of 3T3 fibroblasts cultivated on the surface of PP mesh, PP mesh functionalized with PCL nanofibers (PP + PCL), PCL nanofibers, and TCP. MTT assay revealed significantly higher viability of 3T3 fibroblasts on the PP + PCL and PCL scaffolds on days 1, 3, 7, and 10 (indicated by asterisks) compared with scaffolds without functionalization (PP).
Notes: The level of statistical significance for the assays is designated above the mean values (P<0.05 indicated by number, P<0.001 indicated by number and asterisks). Day 1: 2>1; 3>1; 4>1*, 2*, 3*. Day 3: 2>1; 3>1; 4>1*, 2*, 3*. Day 7: 2>1*; 3>1; 4>1*, 2*, 3*. Day 10: 2>1*; 3*>1; 4>1*, 2*, 3*.
Abbreviations: PP, polypropylene; PCL, poly-ε-caprolactone; TCP, tissue-culture polystyrene; MTT, 3-(4,5-dimethylthiazol-2-yl)-2,5-diphenyltetrazolium bromide.
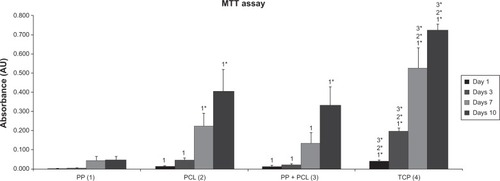
Table 3 Average values of the biomechanical quantities
Figure 7 Average values of maximal strength force per square unit in N/mm2 (MPa) after 6 weeks.
Note: *P<0.05.
Abbreviations: σmax, average value of maximal strength force per square unit; PP, polypropylene; PCL, poly-ε-caprolactone; GF, growth factor.
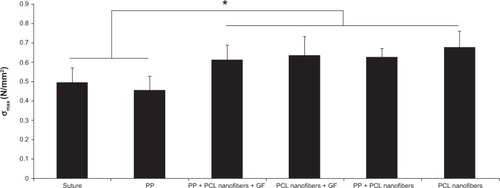
Figure 8A–D Quantitative histological results.
Notes: (A) Inflammatory infiltrate in the medial healing incision in group I (suture only), II (PP mesh), III (PP mesh functionalized with PCL nanofibers enriched with adhered GF), IV (PCL nanofibers enriched with adhered GF), V (PP mesh functionalized with PCL nanofibers), and VI (PCL nanofibers alone). (B) Fraction of α-smooth-muscle actin-positive vascular smooth-muscle cells and myofibroblasts in the medial healing incision in groups I–VI. (C) Density of microvessel profiles in medial healing incisions in groups I–VI. (D) Density of microvessel profiles in the abdominal wall 20 mm lateral from the incision in groups I–VI. Data are presented as medians with boxes spanning the upper limits of the first and third quartiles and with whiskers spanning the minimum and maximum values for each group. P-values of Kruskal–Wallis analysis of variance (ANOVA) show differences among groups under study.
Abbreviations: PP, polypropylene; PCL, poly-ε-caprolactone; GF, growth factor; Aa, area fraction; Qa, section area.
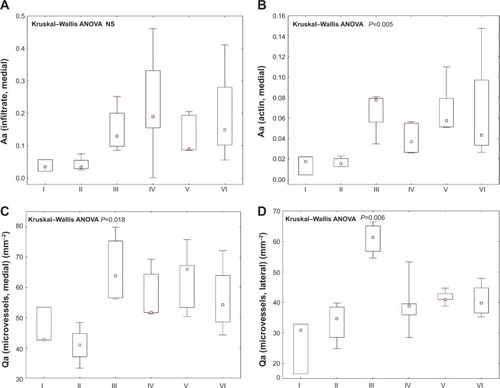
Figure 9A–F α-Smooth-muscle positivity in the scaffolds under study.
Notes: The density of the microvessels (some of them pointed out with black arrows) and the area fraction of actin-positive cells (vascular smooth muscle and myofibroblasts, some of the accumulated myofibroblasts highlighted with blue arrows) were highest in the PP mesh samples functionalized with PCL nanofibers enriched with adhered GF (C), followed by the PP mesh functionalized with PCL nanofibers (E), PCL nanofibers (F), and PCL nanofibers enriched with adhered GF (D), while the lowest values were found in samples of pure PP meshes (B) and sham-operated animals with no mesh (A). Immunohistochemistry for α-smooth-muscle actin, counterstaining Gill’s hematoxylin. Magnification 100×, scale bar 200 μm.
Abbreviations: PP, polypropylene; PCL, poly-ε-caprolactone; GF, growth factor.
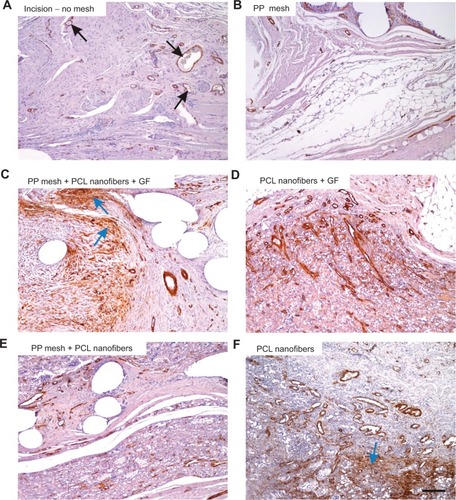
Figure 10A–F Collagen, adipose tissue, and granulomatous infiltration in the scaffolds under study.
Notes: In samples without any mesh (A), the incision was healing with a mixture of collagen (black arrow), adipose connective tissue (red arrow), and inflammatory infiltrate (yellow arrow). Samples with PP mesh (B) had a high fraction of adipose tissue, but the spaces showing the dissolved mesh (black arrows) were surrounded by only a few inflammatory cells. Remnants of the nanofibers (C–F) were surrounded by granulomatous leukocyte-rich connective tissue (yellow arrows). The highest fraction of collagen (red arrow) was in samples of PCL nanofibers with adhered GF (D), followed by samples with no mesh (A) and by samples of PCL nanofibers (F). Low fractions of adipose tissue were found in samples of PCL nanofibers with adhered GF (D), samples with no mesh (A), and in samples of PCL nanofibers (F). Verhoeff’s hematoxylin and green trichrome staining. Magnification 100×, scale bar 200 μm.
Abbreviations: PP, polypropylene; PCL, poly-ε-caprolactone; GF, growth factor.
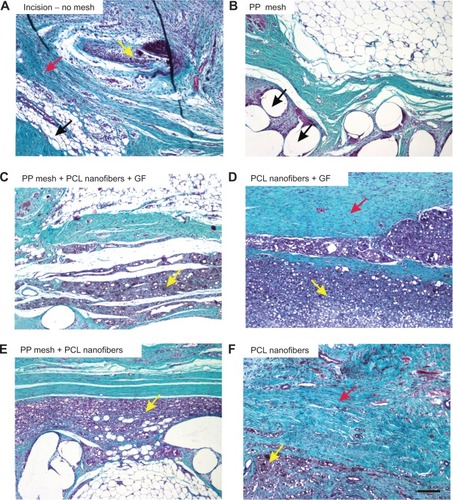
Table 4 Nonparametric Spearman rank-order correlations between the quantitative parameters at the healing incision (medial side)/without incision (lateral side)