Figures & data
Figure 1 Representative scanning electron micrographs of electrospun coatings containing (A) 10% (weight/weight) vancomycin and (B) no drug. Both of the formulations produced continuous, defect-free nanofibers with no visible evidence of phase separation. The scale bar in each micrograph represents 100 μm.
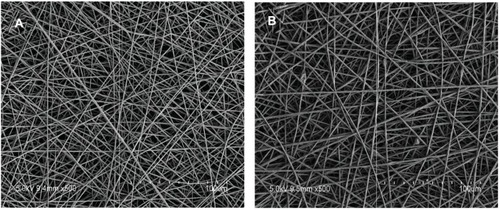
Figure 2 In vitro release profiles of vancomycin from the vancomycin-coated titanium implants performed in phosphate-buffered saline at 37°C exhibited an initial burst release, followed by a slow and controlled release.
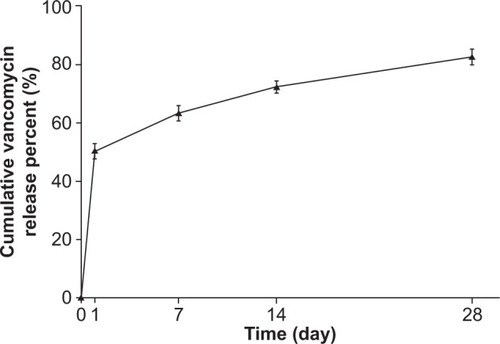
Figure 3 Cell viability measured by Cell Counting Kit-8. Asterisk represents the significant difference between the two groups (P<0.05).
Note: Cell Counting Kit-8; Dojindo Laboratories, Kumamoto, Japan.
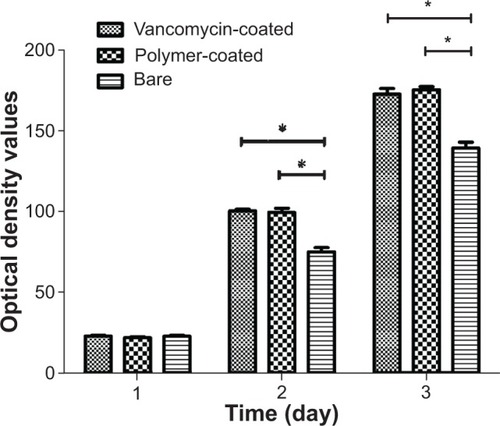
Figure 4 Representative photographs of the inhibition zone of the vancomycin group showing (A) day 1, (B) day 7, (C) day 14, and (D) day 28. (E) The inhibition zone was at the maximum on the first day (average diameters of 12.7±0.4 mm). During the next testing period, the diameters of the zone of inhibition remained around 8 mm.
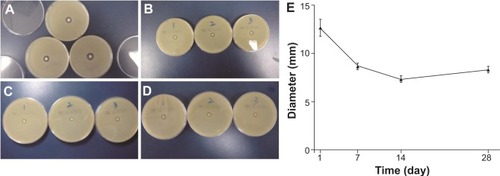
Table 1 The results of serum biochemical parameters from three groups
Figure 5 Macroscopic findings of the surgical site at week 4 after implantation. (A) Pus (black arrow) and necrotic tissue (white arrow) were observed in the groups without drug. (B) Basic normal bone and soft tissue (white arrow) were observed around the titanium implant, which was coated with incomplete degraded white vancomycin-loaded coating (black arrow).
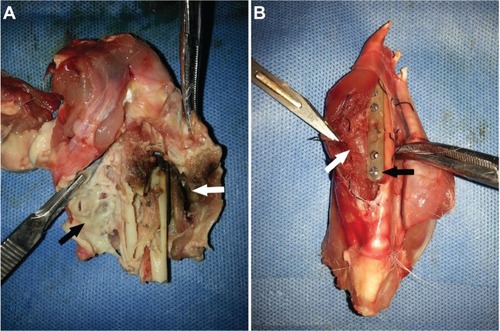
Figure 6 (A,B) Representative X-ray images after surgery. (C) Tibia with vancomycin-coated implant: new bone formation and slight soft-tissue swelling were observed. (D) Tibia without vancomycin-coated implant: osteolysis (white arrow) and serious soft-tissue swelling are clearly visible.
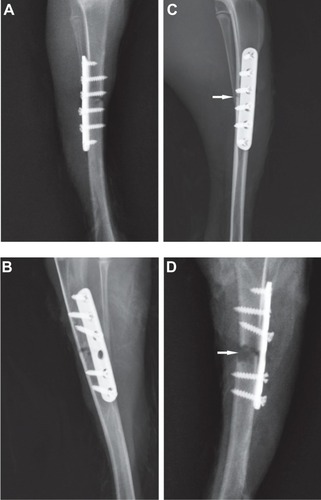
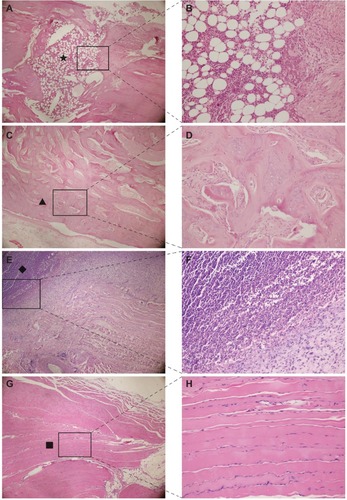
Figure 7 Hematoxylin and eosin staining of bone (A,C) and soft tissue around the implants (E,G). Magnified images in the squared area are displayed (B,D,F,H). Many inflammatory cells (A,B) were observed in the bone marrow cavity in the control group. Many abscesses (E,F) were located in the area around the control implant. New bone formation around the coating (C,D) and basic normal muscle (G,H) were observed in the vancomycin group. (A,C,E,G) (magnification ×40); (B,D,F,H) (magnification ×200). Notes: Black star represents inflammatory cells (A). Black triangle represents new bone formation (C). Black diamond represents abscesses (E). Black square represents basic normal muscle (G).