Figures & data
Table 1 Clinical scoring of mice
Figure 1 MSc1 HRTEM image (A); nanoparticle size–distribution histogram of MSc1 (B); IR spectrum (C) and complexometric titration (D); MSc1 iron preservation at pH 1–7 (E).
Abbreviations: HRTEM, high-resolution transmission electron microscopy; IR, infrared; L, length.
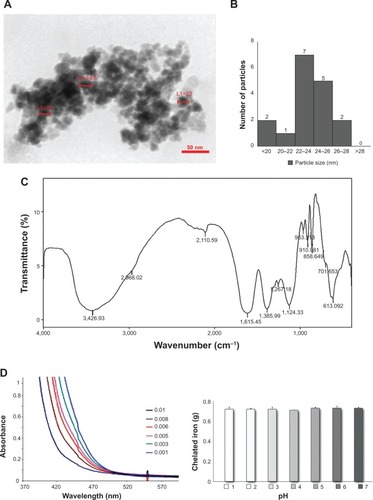
Table 2 MSc1-toxicity report
Figure 2 PC12 cell protection from H2O2-induced oxidative toxicity by MSc1 (A) and MSc1-Fe (B).
Notes: *P<0.05; #significant difference was determined by comparison to this group.
Abbreviation: PC, pheochromocytoma.
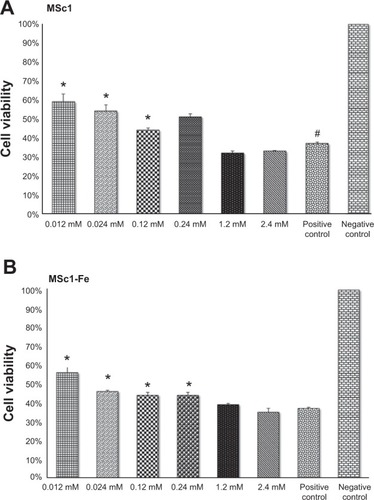
Figure 3 Clinical scores of mice during 54 days after EAE induction (A); ratio of clinical score increase on day 54 in relation to day 14 in the control and test groups (B); ratio of clinical score increase on day 24 in relation to day 14 in the control and high-dose groups (C).
Notes: The clinical score from each group at the end of the experiment (day 54) was divided over the clinical score from each group at the beginning of the treatment (day 14) to demonstrate the efficacy of the nanocomplex in controlling EAE progression by using mathematical logic (B); the clinical score on day 24 (when the clinical score was the highest in the control group) was divided over the clinical score on day 14 (the beginning of the treatment) to mathematically indicate the success of high-dose MSc1 in deferring disease progression (C).
Abbreviation: EAE, experimental autoimmune encephalomyelitis.
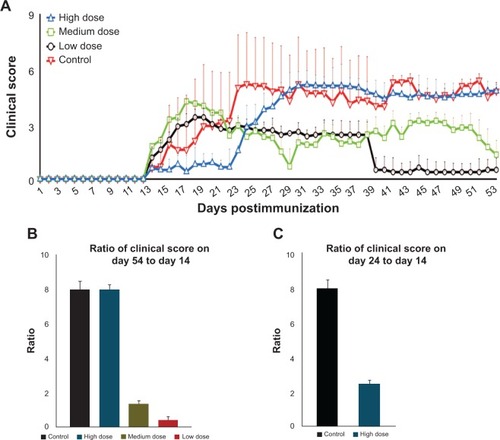
Figure 4 Effect of MSc1 on survival probability (A), the body weight of the mice (B) and percent of weight gain (C).
Notes: Mass changes are presented in this graph during days 14–54 (A); percentage of mass increase on days 28–14 postimmunization is shown (C). The medium dose had the best effect.
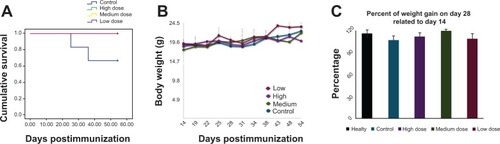
Figure 5 Average RBC counts (A); average Hb concentrations (B); average hepatic iron levels (C).
Note: *P<0.05.
Abbreviations: RBC, red blood cell; Hb, hemoglobin; PBS, phosphate-buffered saline; M, million.
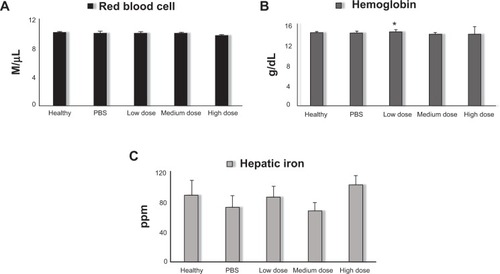
Table 3 White blood cell (WBC) differential count results
Figure 6 H&E brain staining in control group (A) and MSc1-treated mice (B); LFB staining in control group (C) and MSc1-treated mice (D).
Notes: Infiltration of lymphocytes (A) and demyelination (C) in the control mice; no lymphocyte infiltration (B) or demyelination (D) in the MSc1-treated mice. Arrows show lymphocyte infiltration.
Abbreviation: H&E, hematoxylin and eosin; LFB, Luxol fast blue.
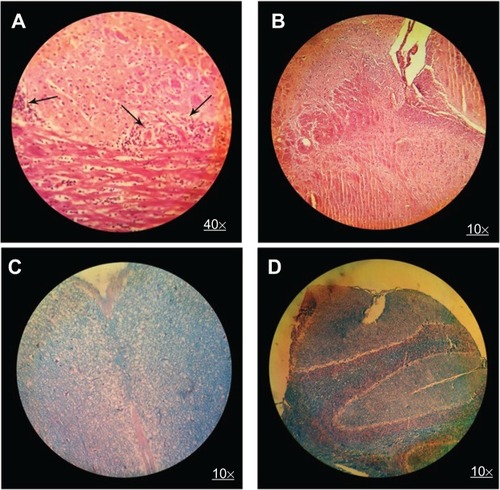
Figure S1 Brightfield microscopy images from PC12 negative control (A), positive control (B), and MSc1-treated cells (C).
Notes: Negative control cells are PC12 with no treatment (A), positive control cells treated for 24 hours by 300 μM of H2O2 (B), cells pretreated for 24 hours by MSc1 then treated by 300 μM of H2O2 (C).
Abbreviation: PC, pheochromocytoma.
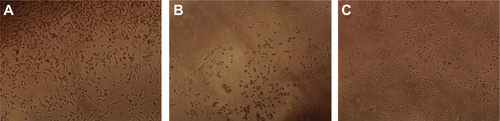
Figure S2 Determination of clinical score of EAE mice.
Notes: Healthy =0 (A); tail paralysis =2 (B); tail paralysis and paralysis of one hind-limb (C); tail paralysis and total hind-limb paralysis (D); tail, hind-limb, and forelimb paralysis (E). Arrows show the disabled limbs.
Abbreviation: EAE, experimental autoimmune encephalomyelitis.
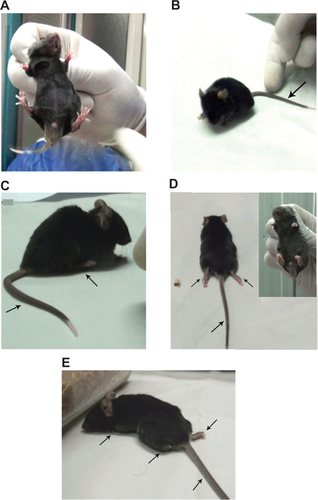
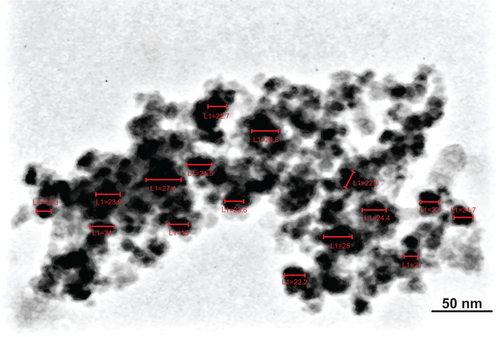
Figure S3 Scaling of transmission electron microscopy image of MSc1 for nanoparticle size–distribution histogram.
Abbreviation: L, length.