Figures & data
Figure 1 (A) FTIR scan of AG; (B) electrospray ionization mass spectra of AG; (C) X-ray diffraction spectra of AG and CsAGNP nanosystems; (D) FTIR scan of biopolymer Cs; (E) FTIR scan of CsAGNP nanosystem.
Abbreviations: Cs, chitosan; FTIR, Fourier-transform infrared; AG, andrographolide; CsAGNP, chitosan-modified AG nanoparticle.
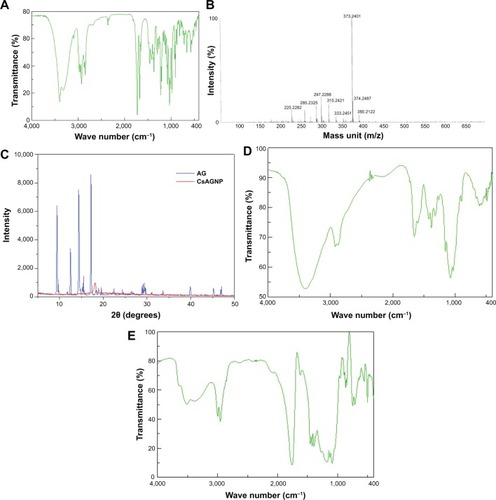
Figure 2 (A) Size distribution of CsAGNPs; (B) 3-D atomic force microscopy data of CsAGNPs; (C) In vitro dissolution studies for CsAGNPs (blue) in phosphate buffer, pH 7.4.
Abbreviations: AG, andrographolide; CsAGNPs, chitosan-modified AG nanoparticles.
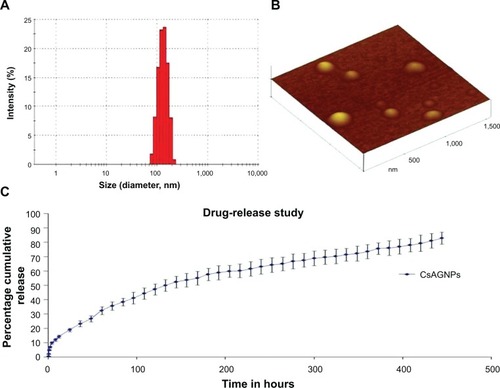
Table 1 Liver function markers and lipid peroxidation in treatment conditions
Figure 3 Histopathological changes of liver cytoarchitecture after various treatments, magnification 400×, normal liver, CCl4-treated liver, AG-treated liver, CsAGNP-treated liver.
Abbreviations: AG, andrographolide; CsAGNPs, chitosan-modified AG nanoparticles.
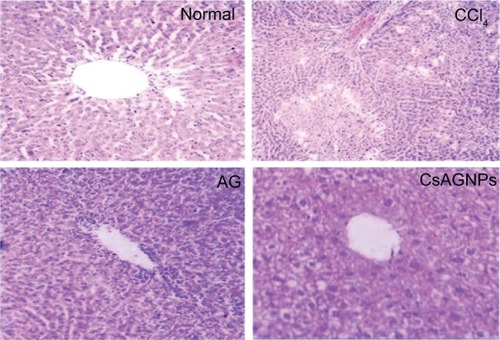
Figure 4 Levels of hepatic enzymatic antioxidant markers before and after CCl4-induced hepatotoxicity. Results are expressed as means ± standard deviation (n=6).
Notes: *P<0.001, significant difference compared with CCl4-treated group; **P<0.05 significant difference compared among AG- and CsAGNP-treated groups.
Abbreviations: AG, andrographolide; CsAGNPs, chitosan-modified AG nanoparticles; SOD, superoxide dismutase; CAT, catalase; GPx, glutathione peroxidase; GR, glutathione reductase; GST, glutathione S-transferase.
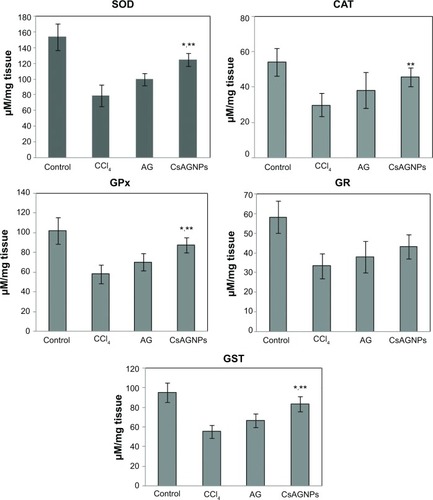
Table 2 Nonenzymatic hepatic antioxidants in CCl4-induced hepatotoxicity
Table 3 Serum levels of inflammatory markers
Figure 5 Fluorescein isothiocyanate-labeled nanoparticle localization in the liver after 4 hours of administration.
Notes: (A) Transmitted image; (B) fluorescent image.
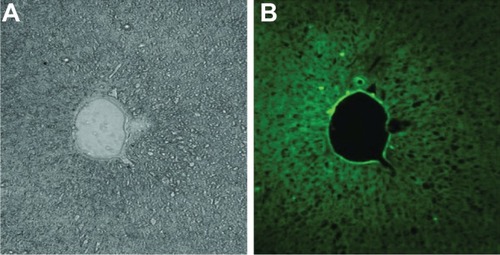
Figure S1 Ultraviolet maximum absorbance for andrographolide extracted in 5 μg/mL chloroform solution.
Note: The arrows (numbered 1, 2, and 3), indicate specific peak positions for andrographolide in UV-visible scanning.
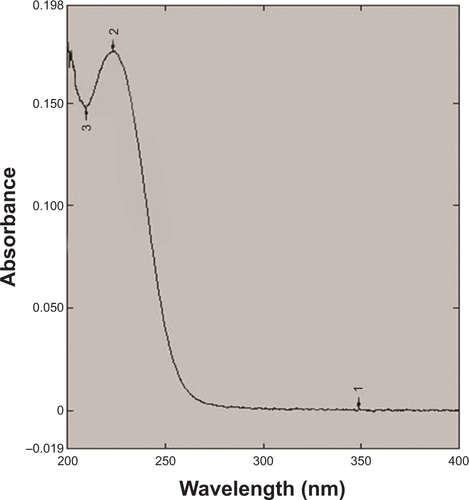
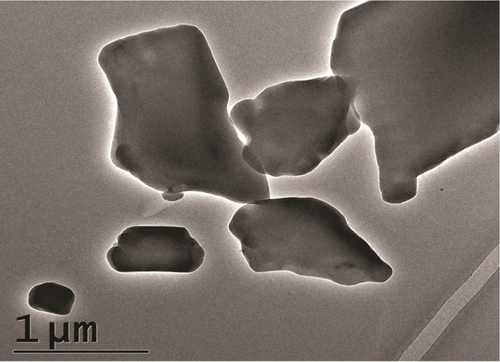
Figure S2 Engineered andrographolide nanosystems in water: transmission electron microscopy.
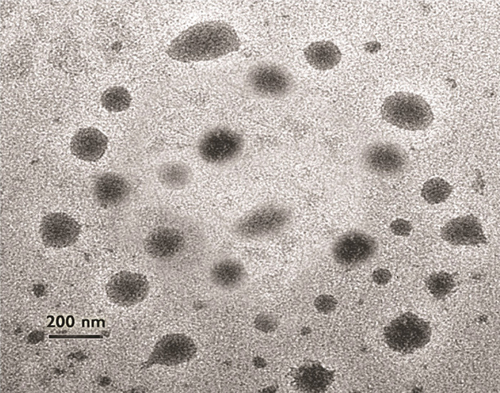
Figure S3 Irregular andrographolide crystals in water: transmission electron microscopy.