Figures & data
Figure 1 Transmission electron microscopy image (A), energy dispersive spectroscopy (B), and X-ray diffraction (C) patterns of nanofluorapatite (bar represents 100 nm).
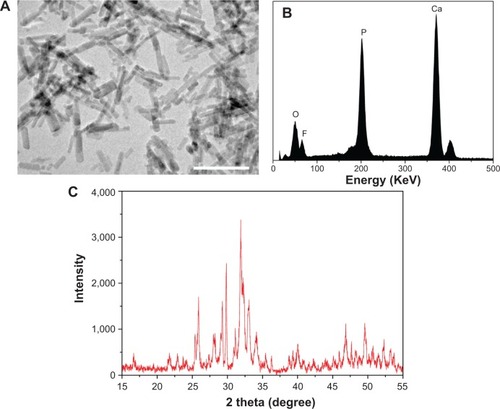
Table 1 Mechanical properties and water contact angles of nanofluorapatite (n-FA)/polyamide 12 (PA12) composite with 40 wt% n-FA and PA12
Figure 2 Scanning electron microscopy images of surface morphology of (A) nanofluorapatite (n-FA)/polyamide 12 (PA12) composite with 40 wt% n-FA and (B) PA12.
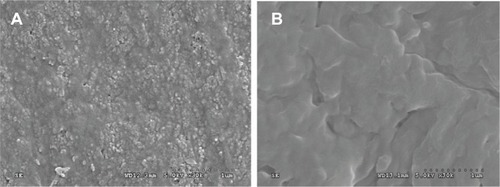
Figure 3 Number of viable bacteria (Escherichia coli) adherence on nanofluorapatite (n-FA)/polyamide 12 (PA12) composite with 40 wt% n-FA and PA12 after 24 hours (105 colony forming units).
Note: *Indicates significant difference.
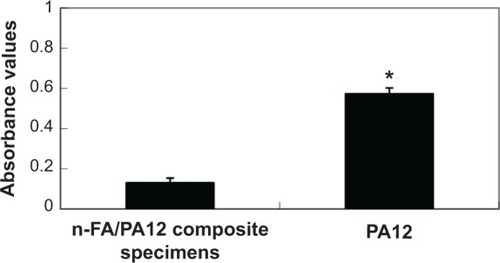
Figure 4 Proliferation of MC3T3-E1 cells cultured on nanofluorapatite (n-FA)/polyamide 12 (PA12) composite with 40 wt% n-FA and PA12 for 1 day, 3 days, and 5 days.
Note: *Indicates significant difference.
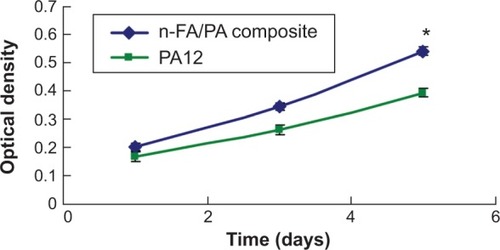
Figure 5 Phase contrast microscopy photographs of MC3T3-E1 cells cultured with (A) nanofluorapatite (n-FA)/polyamide 12 (PA12) composite with 40 wt% n-FA and (B) PA12 at 3 days.
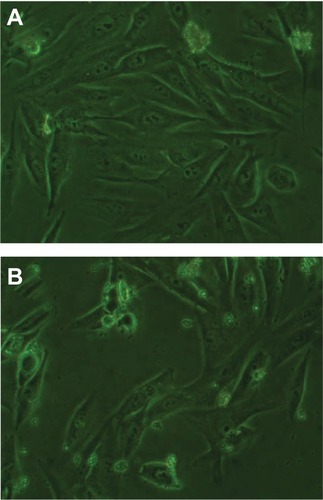
Figure 6 Alkaline phosphatase activity of MC3T3-E1 cultured on both nanofluorapatite (n-FA)/polyamide 12 (PA12) composite with 40 wt% n-FA and PA12 at 4 days and 7 days.
Note: *Indicates significant difference.
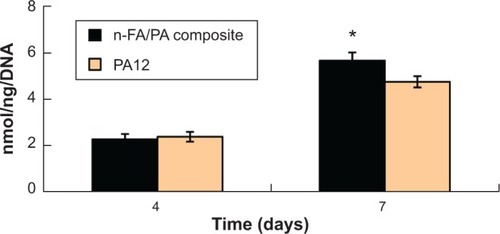
Figure 7 Scanning electron microscopy images of surface morphology of (A) nanofluorapatite (n-FA)/polyamide 12 (PA12) composite with 40 wt% n-FA and (B) PA12.
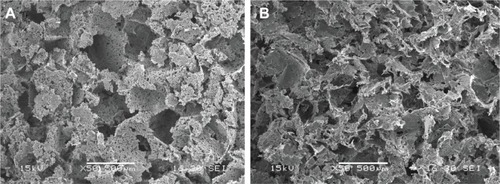
Figure 8 Scanning electron microscopy images of MC3T3-E1 cells attached and spread on the surfaces of (A) nanofluorapatite (n-FA)/polyamide 12 (PA12) composite with 40 wt% n-FA and (B) PA12 at 3 days.
Note: *Represents cells.
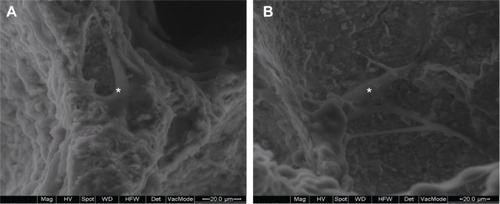
Figure 9 Hematoxylin and eosin stained section of (A, C) nanofluorapatite (n-FA)/polyamide 12 (PA12) composite with 40 wt% n-FA and (B, D) PA12 implanted into bone defects of rabbit femora for (A, B) 4 weeks and (C, D) 8 weeks.
Note: B represents new bone tissue and M represents gradually degraded materials.
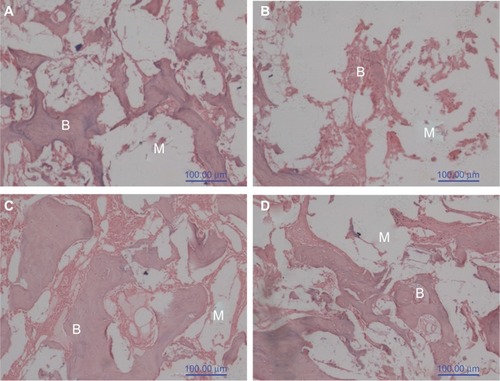
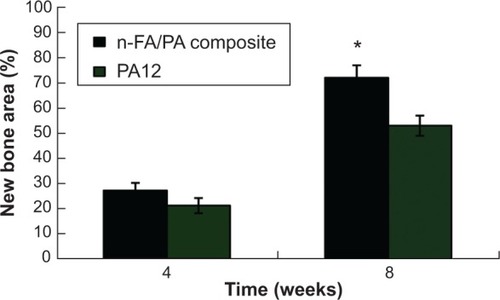
Figure 10 Percentage of newly formed bone area in both nanofluorapatite (n-FA)/polyamide 12 (PA12) composite with 40 wt% n-FA and PA12 at 4 weeks and 8 weeks.
Note: *Indicates significant difference.
Abbreviation: PA12, nanofluorapatite (n-FA)/polyamide 12 composite.