Figures & data
Figure 1 AFM imaging and the size distribution of PEG-GO. AFM images of GO-COOH (A) and PEG-GO (B) deposited on mica substrate and thickness were analyzed using AFM micrographs. (C) The particle size distribution of PEG-GO was measured by dynamic laser scattering.
Abbreviations: AFM, atomic force microscopy; GO-COOH, carboxyl graphene oxide; PEG-GO, polyethylene glycol-coated graphene oxide.
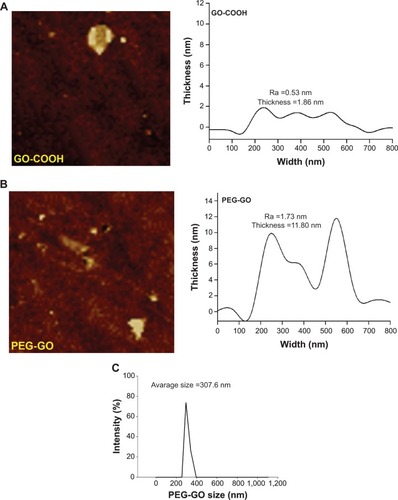
Figure 2 Successful formation of PEG-GO. (A) TGA curves of GO-COOH and PEG-GO with a heating rate of 10°C/min in N2. The C1s peaks in the XPS spectra of (B) GO-COOH and (C) PEG-GO.
Abbreviations: GO-COOH, carboxyl graphene oxide; PEG-GO, polyethylene glycol-coated graphene oxide; TGA, thermogravimetric analysis; XPS, X-ray photoelectron spectroscopy.
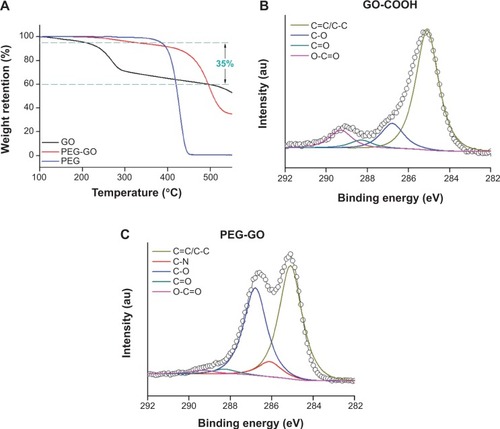
Table 1 The C1s X-ray photoelectron spectroscopy spectrum parameter of carboxyl graphene oxide (GO-COOH) and polyethylene glycol-coated graphene oxide (PEG-GO)
Figure 3 No effects of polyethylene glycol-coated graphene oxide (PEG-GO) on the body weight and spleen index of OVA-sensitized mice.
Notes: Mice were treated with PEG-GO and sensitized with OVA as described in the materials and methods section. (A) The body weight of mice prior to PEG-GO administration (day 0) and prior to sacrifice (day 7) was measured. (B) Spleens were isolated and weighted aseptically after sacrifice. The spleen index was defined as the ratio of spleen weight (mg) to body weight (g). Data are expressed as the mean ± standard error of four to five mice. Results are representative of three independent experiments.
Abbreviations: NS, untreated and not sensitized; OVA, ovalbumin; PEG-GO, PEG-GO-treated and OVA-sensitized; VH, saline-treated and OVA-sensitized.
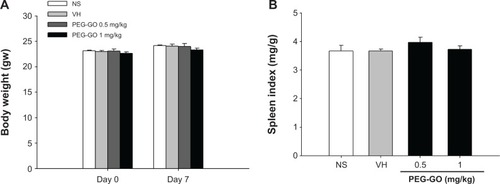
Table 2 The effect of polyethylene glycol-coated graphene oxide (PEG-GO) on the serum production of ovalbumin (OVA)-specific antibodiesTable Footnotea
Figure 4 The effect of PEG-GO on the production of OVA-specific cytokines by splenocytes.
Notes: Mice were treated with PEG-GO and sensitized with OVA as described in the materials and methods section. The splenocytes (5×10⁶ cells/mL) isolated from each group of mice were restimulated with OVA (50 μg/mL) in culture for 72 hours to induce cytokine production. The levels of (A) IFN-γ and (B) IL-4 in the supernatants were measured by ELISA. Data are expressed as the mean ± standard error of triplicate cultures. *P<0.05 compared with the VH control. Results are a representative of three independent experiments.
Abbreviations: ELISA, enzyme-linked immunosorbent assay; IFN, interferon; IL, interleukin; OVA, ovalbumin; PEG-GO, polyethylene glycol-coated graphene oxide; VH, vehicle (saline)-treated and OVA-sensitized; NS, nonsensitized; ND, the level of IL-4 is below the limit of quantification.
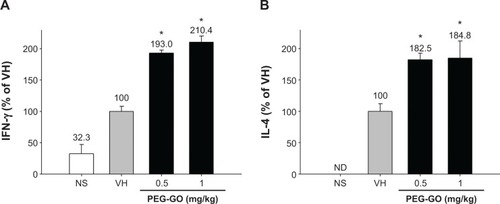
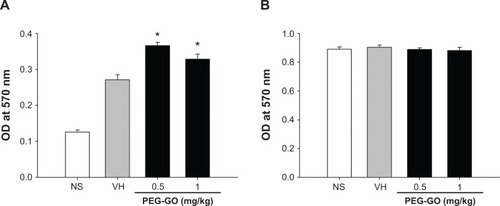
Figure 5 The effect of PEG-GO on the metabolic activity of splenocytes.
Notes: Mice were treated with PEG-GO and sensitized with OVA as described in the materials and methods section. The splenocytes (5×10⁶ cells/mL) isolated from each group of mice were cultured in the presence of (A) OVA (50 μg/mL) for 72 hours or (B) concanavalin A (5 μg/mL) for 48 hours, and their metabolic activity was determined by an MTT assay. Data are expressed as the mean ± standard error of triplicate cultures. *P<0.05 compared with the VH group. Results are a representative of three independent experiments.
Abbreviations: MTT, 3-(4,5-dimethylthiazol-2-yl)-2,5-diphenyltetrazolium bromide; OVA, ovalbumin; PEG-GO, polyethylene glycol-coated graphene oxide; VH, vehicle (saline)-treated and OVA-sensitized; OD, optical density; NS, nonsensitized.