Figures & data
Figure 1 (A) Schematic representation of the experimental setup for temperature measurement. (B) Temporal temperature response at the focal point in the mouse brain before, during and after 10 minutes of continuous FUS sonication.
Notes: The brain temperature of an anesthetized mouse was approximately 29°C before the FUS. The arrows in (B) indicate the time for FUS “on” and “off.”
Abbreviation: FUS, focused ultrasound.
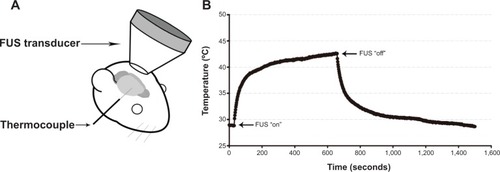
Figure 2 (A) Schedule for PLD injection and quantification. (B) Time course of tumor implantation and PLD and/or short-time FUS hyperthermia administration.
Abbreviations: PLD, pegylated liposomal doxorubicin; FUS, focused ultrasound.
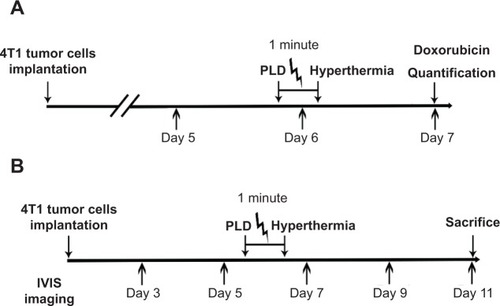
Figure 3 Doxorubicin concentrations in tumor and normal brain tissues in mice with and without short-time FUS hy.
Notes: Female BALB/c mice were transcranially implanted with 4T1-luc2 murine breast cancer cells and received 5 mg/kg PLD with or without transcranial FUS hyperthermia on day 6 after tumor implantation. FUS hyperthermia enhanced the PLD delivery in the tumor regions. Data are presented as the mean ± SEM (n=5 for each group). *P<0.05.
Abbreviations: FUS, focused ultrasound; PLD, pegylated liposomal doxorubicin; hy, hyperthermia; SEM, standard error of the mean; ns, not significant.
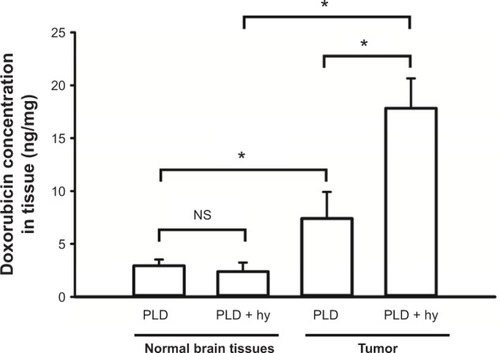
Figure 4 IVIS imaging of mouse brain tumors from day 3 to day 11 after tumor implantation.
Notes: (A) Mice with luciferase-expressing 4T1-luc2 breast cancer cells implanted in their striatum tissue. There were four groups: control (no treatment), hyperthermia, PLD, and PLD + hyperthermia. Treatment was executed on day 6 after tumor implantation, and images were obtained every other day. (B) Bioluminescent signals were quantified using the IVIS imaging system. The arrow indicates when the different treatments were performed. Note that PLD + hyperthermia markedly inhibited breast tumor growth in the brain. Data are presented as the mean ± SEM (n=6 for each group). *P<0.05 compared with the control group.
Abbreviations: PLD, pegylated liposomal doxorubicin; SEM, standard error of the mean.
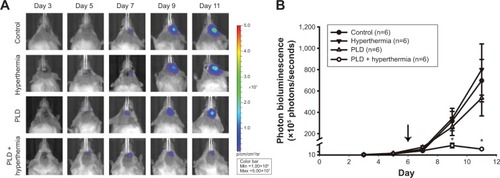
Figure 5 Histological (H&E) and immunohistochemical (Ki67) staining performed in tumor regions following the different treatments.
Notes: Mice were implanted with 4T1-luc2 tumor cells with treatment performed on day 6. The mice were sacrificed on day 11. Tumor slices were then obtained for staining. Tumors treated with PLD + hyperthermia had smaller tumors than the control group based on H&E staining (upper panels). Ki67 expression was associated with cell proliferation. Mild Ki67 expression was found in the tumor area of the PLD + hyperthermia-treated group. Scale bars =100 μm and 1 mm, respectively.
Abbreviations: PLD, pegylated liposomal doxorubicin; H&E, hematoxylin and eosin.
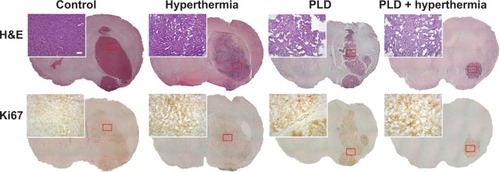
Figure 6 Quantitative analysis of Ki67-positive and TUNEL-positive cells.
Notes: (A) The number of Ki67 positive cells significantly decreased in the PLD + hyperthermia group compared with those in the PLD group. (B) TUNEL-positive cells were increased in the PLD + hyperthermia group. Data are shown as the mean ± SEM (n=3 for each group). *P<0.05 compared with the control group. #P<0.05 compared with the PLD group.
Abbreviations: PLD, pegylated liposomal doxorubicin; TUNEL, terminal deoxynucleotidyl transferase dUTP-mediated nick-end labeling; SEM, standard error of the mean; dUTP, deoxyuridine triphosphate.
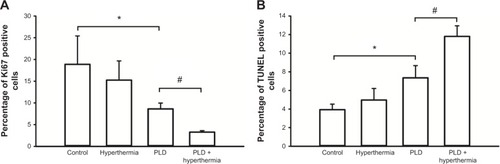
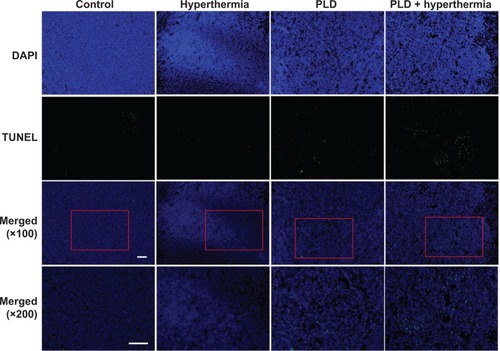
Figure 7 TUNEL staining used to detect apoptotic cells in the tumor.
Notes: Mice were implanted with 4T1-luc2 tumor cells with treatment performed on day 6. The mice were sacrificed on day 11. Tumor slices were then obtained for staining. In the first row, tissues were stained with DAPI to visualize the tumor cells (blue) in the brain section. In the second row, tissues were stained with terminal TUNEL (green). The third and fourth rows display an overlay of the two images showing the distribution of apoptotic cells in the tumors at different magnifications. Strong apoptotic signals were expressed in the tumors treated with PLD + hyperthermia. Scale bar =100 μm.
Abbreviations: PLD, pegylated liposomal doxorubicin; DAPI, 4′,6-diamidino-2-phenylindole; TUNEL, terminal deoxynucleotidyl transferase dUTP-mediated nick-end labeling; dUTP, deoxyuridine triphosphate.