Figures & data
Table 1 Characterization summary for gold nanoparticles
Figure 1 Characterization of the GNPs. (A) TEM images of GNPs (scale bar, 20 nm). (B) Size distributions measurements of the GNPs. (C) Ultraviolet –visible spectra of the GNPs. Abbreviations: TEM, transmission electron microscope; GNP, gold nanoparticles.
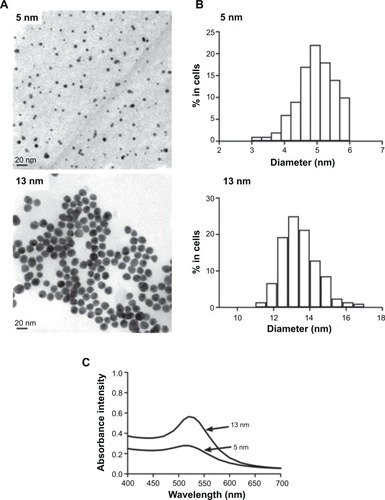
Figure 2 Cytotoxicity of normoxic and hypoxic HK-2 cells by MTT (A) and LDH assays (B) after incubation with the 5 and 13 nm GNPs (0, 1, 25, and 50 nM) for 24 hours.
Notes: Error bars represent mean ± SD (n=3). *P<0.05 and it indicates a statistically significant difference compared to the control.
Abbreviations: GNPs, gold nanoparticles; LDH, lactate dehydrogenase.
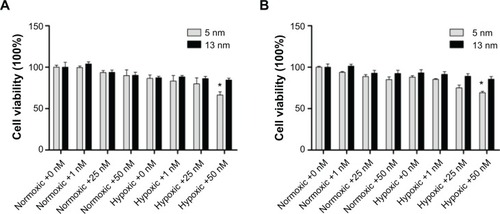
Figure 3 The GNP uptake and intracellular localization (A–C) and TEM images of normoxic (D–F) and hypoxic HK-2 cells (G–L) after 24 hour incubation with the 5-nm 50 nM GNPs.
Notes: Representative bright field images of the HK-2 cells untreated (A) or treated with the 5-nm 50 nM GNPs under normoxic (B) and hypoxic conditions (C). The GNPs form distinct, dark aggregates in the cells (black short arrows). GNPs were localized in lysosomes (black long arrows) and autophagosomes (white long arrows) (E), (H), and (K) represents the enlargement of black square area indicated in (D), (G), and (J), respectively.
Abbreviations: GNP, gold nanoparticles; TEM, transmission electron microscopy.
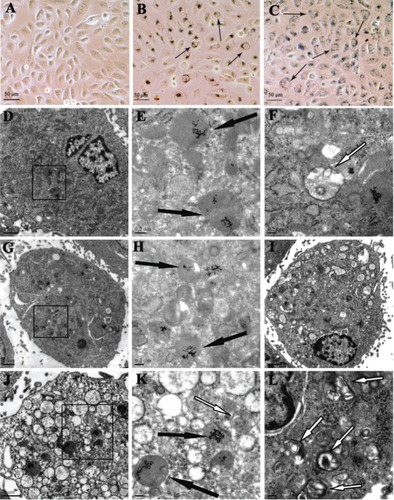
Figure 4 The effect of GNPs on the apoptosis in HK-2 cells by annexin V-FITC/PI double-staining analysis.
Notes: FCM images (A) and quantitative data (B) of HK-2 cells exposed to 0 or 50 nM GNPs for 24 hours in normoxic or hypoxic conditions. One-way analysis of variance followed by Dunnett’s post hoc test was used for statistical analysis. The data were shown as mean ± SD, n=3. ***P<0.001.
Abbreviations: PI, propidium iodide; FITC, fluorescein isothiocyanate; SD, standard deviation; GNP, gold nanoparticles; FCM, fuzzy c-means.
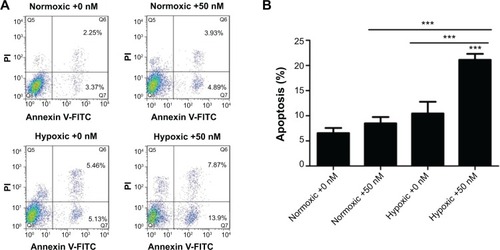
Figure 5 Autophagy detection in the GNP-treated cells.
Notes: (A) Immunofluorescent images of the cells showing LC3B-protein-marked vesicles. (B) The proportion of LC3 positive cells (with at least five LC3 dots) to total cells (with green fluorescence) in images from (A) was analyzed. (C) The Western blotting analysis of the autophagy proteins LC3B and Beclin-1. Conversion of LC3 from the cytoplasmic form (LC3-I) to the autophagosome-associated form (LC3-II). The cells cultured under starving conditions (depletion of both amino acids and serum) for 4 hours were used as positive controls for autophagy. β-actin served as the loading control. (D) Expression of LC3- II/I relative to that of β-actin. Error bars represent mean ± SD (n=3). *P<0.05, **P<0.01, and ***P<0.001.
Abbreviations: LC3, light chain 3; DAPI, 4′,6-diamidino-2-phenylindole; GNP, gold nanoparticles; SD, standard deviation.
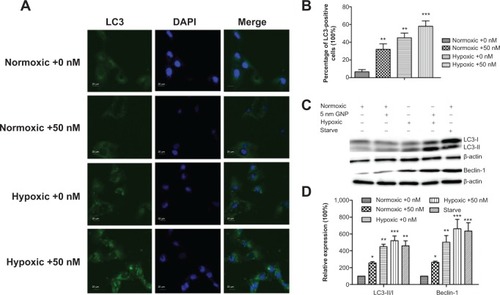
Figure 6 ROS formation in the GNP-treated HK-2 cells for 24 hours under normoxic or hypoxic conditions.
Notes: (A) FCM images of ROS fluorescence intensities within the cells and expressed as the percentage of the DCF fluorescencent intensity of the control. (B) Quantitative analysis of ROS fluorescence intensities. One-way analysis of variance followed by Dunnett’s post hoc test was used for statistical analysis. The data was presented as mean ± SD, n=3. ***P<0.001.
Abbreviations: GNP, gold nanoparticle; ROS, reactive oxygen species; FCM, fuzzy c-means; DCF, 2′,7′-dichlorofluorescein; SD, standard deviation; SSC, side scatter; FL, fluorescence; DCFH-DA, 2′,7′-dichlorofluorescin diacetate.
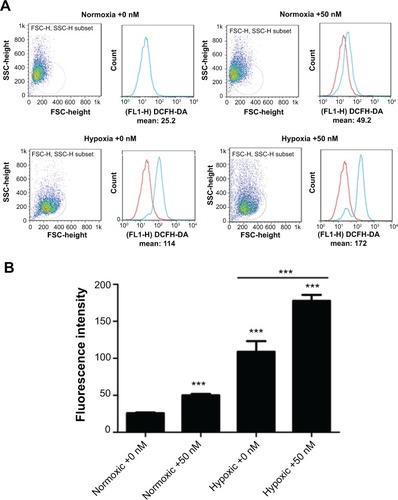
Figure 7 Crosstalk between the GNP-induced autophagy and apoptosis.
Notes: The cells were treated with 0 or 50 nM GNPs for 24 hours under normoxic or hypoxic conditions in the presence and absence of 3-MA and analyzed using (A, B) western blotting analysis of autophagy proteins LC3B, (C) cell viability by CCK-8, and (D, E) apoptosis detection by Annexin-V/PI staining. B and E were the quantitative data shown in A and D, respectively. One-way analysis of variance followed by Dunnett’s post hoc test was used for statistical analysis. Graphs show mean ± SD, n=3. *P<0.05, **P<0.01, and ***P<0.001.
Abbreviations: 3-MA, 3-methyladenine; GNP, gold nanoparticle; CCK-8, cell counting kit 8; PI, propidium iodide; SD, standard deviation.
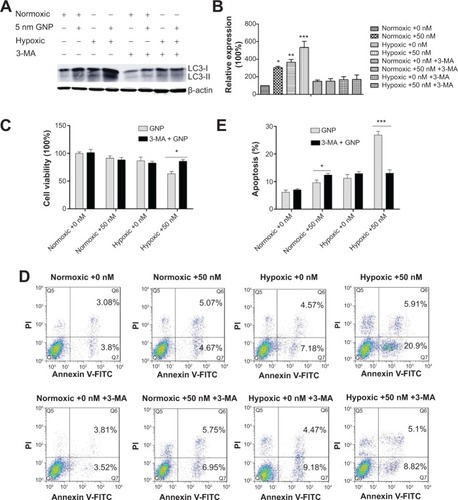
Figure 8 Flow cytometry changes in the mitochondrial membrane potential.
Notes: HK-2 cells treated with 0 or 50 nM GNP for 24 hours under normoxic or hypoxic conditions. The mitochondria membrane potential was measured using the JC-1 apoptosis detection kit. One-way analysis of variance followed by Dunnett’s post hoc test was used for statistical analysis. The data were shown as mean ± SD, n=3. ***P<0.001.
Abbreviations: GNP, gold nanoparticle; SD, standard deviation.
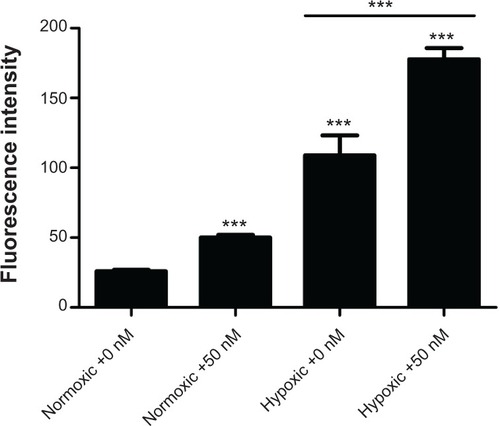
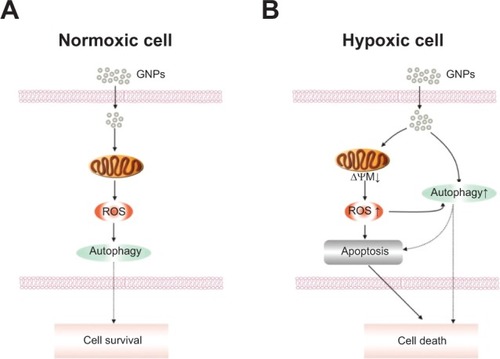
Figure 9 Schematic models of the effects of GNPs in normoxic and hypoxic HK-2 cells.
Notes: GNPs induce autophagy and cell survival in normoxic cells, however, in hypoxic cells, GNPs exposure leads to the production of ROS, loss of ΔΨM, and an increase in apoptosis and autophagic cell death.
Abbreviations: GNP, gold nanoparticle; ROS, reactive oxygen species; ΔΨM, mitochondrial membrane potential.