Figures & data
Figure 1 Schematic representation of micellization of poly(β-amino ester)-g-poly(ethylene glycol) methyl ether-cholesterol (PAE-g-MPEG-Chol).
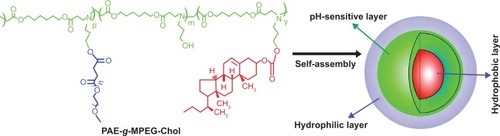
Table 1 GPC and 1H NMR data of PAE-g-MPEG-Chol and its precursors
Figure 2 The synthetic route of poly(β-amino ester)-g-poly(ethylene glycol) methyl ether-cholesterol (PAE-g-MPEG-Chol).
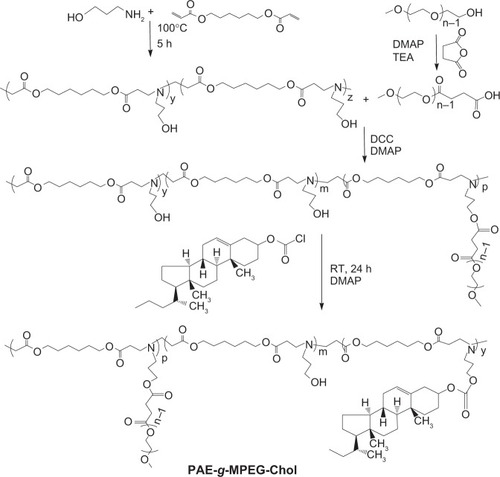
Figure 3 Fourier transform infrared spectra (A) of MPEG-OH and MPEG-COOH and proton nuclear magnetic resonance spectrum (B) of MPEG-COOH.
Abbreviations: MPEG-OH, methoxypoly(ethylene glycol)-hydroxyl; MPEG-COOH, methoxypoly(ethylene glycol)-carboxyl.
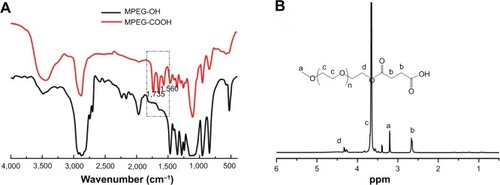
Figure 4 Proton nuclear magnetic resonance spectra of PAE (A), PAE-g-MPEG (B), and PAE-g-MPEG-Chol (C) in deuterated chloroform.
Abbreviations: PAE, poly(β-amino ester); PAE-g-MPEG, poly(β-amino ester)-g-poly(ethylene glycol) methyl ether; PAE-g-MPEG-Chol, poly(β-amino ester)-g-poly(ethylene glycol) methyl ether-cholesterol.

Figure 5 The potentiometric titration (A), and transmittance at 500 nm (B) of the poly(β-amino ester) (PAE) solutions dependent on the different pH values.
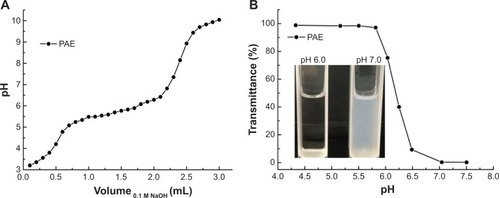
Figure 6 Plot of intensity ratios (I338/I335) as function of logarithm of the poly(β-amino ester)-g-poly(ethylene glycol) methyl ether-cholesterol concentrations (mg/mL) in different pH phosphate-buffered saline (pH 7.4 and 6.0).
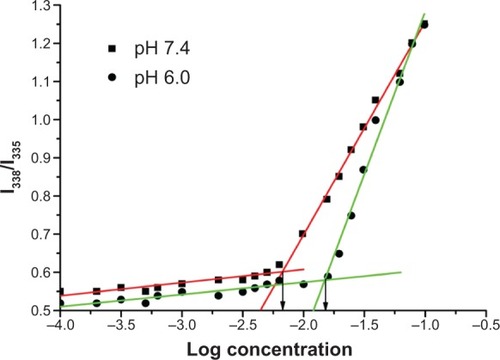
Table 2 Characteristic properties of DOX-loaded PAE-g-MPEG-Chol micelles
Figure 7 Particle size and zeta potential of polymeric micelles were dependent on the pH values.
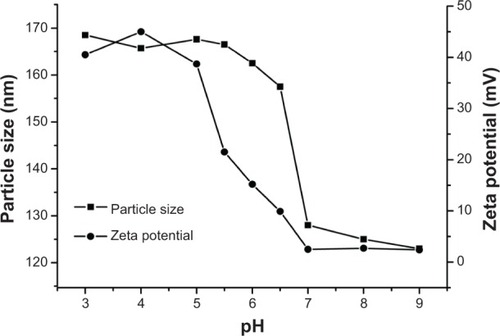
Figure 8 Transmission electron microscopy micrographs of poly(β-amino ester)-g-poly(ethylene glycol) methyl ether-cholesterol micelles (pH=7.4).
Note: The right image is the magnified result of the left image.
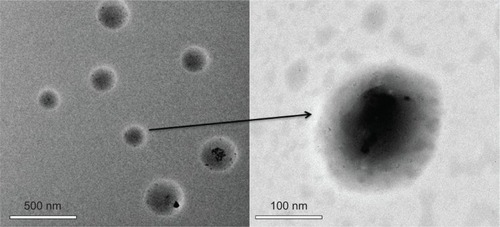
Figure 9 In vitro drug release profiles of doxorubicin-loaded poly(β-amino ester)-g-poly(ethylene glycol) methyl ether-cholesterol micelles dependent on the pH values.
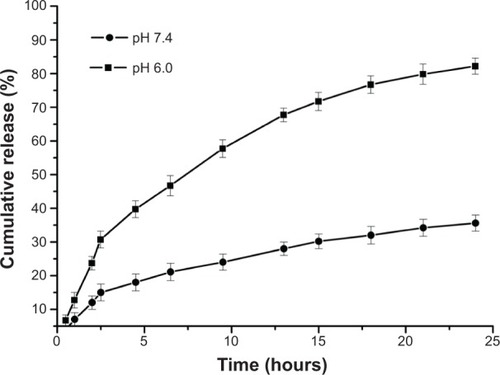
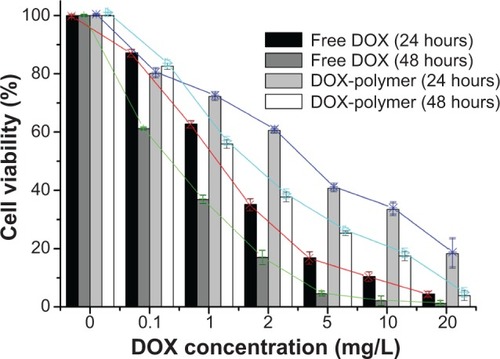
Figure 10 Free doxorubicin (DOX) and DOX-loaded poly(β-amino ester)-g-poly(ethylene glycol) methyl ether-cholesterol (PAE-g-MPEG-Chol) micelles in HepG2 cells for 24 hours or 48 hours in concentration specified.