Figures & data
Figure 1 (A) Synthesis scheme of T-CS. (B) 1H NMR spectra of TNYL, CS, and T-CS.
Abbreviations: CS, chitosan-g-stearate; NMR, nuclear magnetic resonance; T-CS, TNYL-modified CS; NH2-PEG-NH2, fluorescein isothiocyanate (FITC), pyrene, mPEG2000 with amine group.
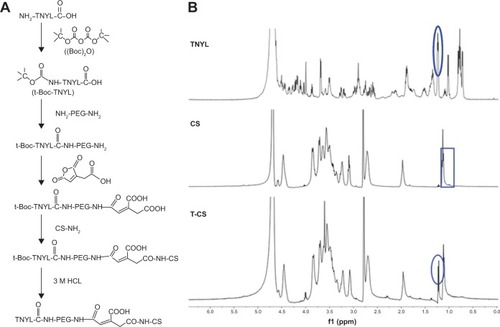
Figure 2 (A) Variation of intensity ratio of I1/I3 against the logarithm of concentration of CS (♦) and T-CS (■). Size distribution obtained by DLS of (B) CS and (C) T-CS micelles.
Note: Unit of concentration was μg/mL.
Abbreviations: CS, chitosan-g-stearate; DLS, dynamic light scattering; T-CS, TNYL-modified CS.
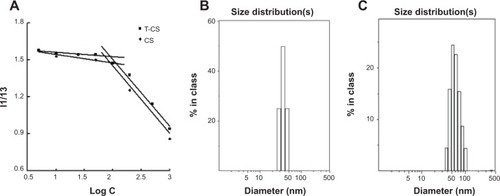
Table 1 Characterization of CS/DOX and T-CS/DOX micelles
Figure 3 TEM images of CS/DOX and T-CS/DOX micelles.
Abbreviations: CS, chitosan-g-stearate; DOX, doxorubicin; TEM, transmission electron microscopy; T-CS, TNYL-modified CS.
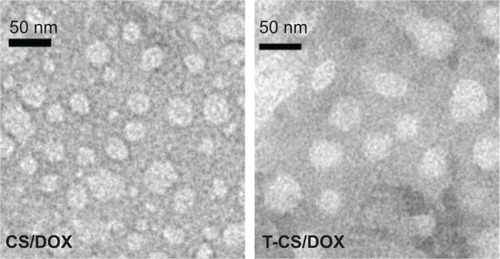
Figure 4 (A) Cellular uptake of T-CS micelles (FITC-labeled) in SKOV3 cells with different incubation times. (B) Quantitative cell uptake analyzed by a flow cytometer, in SKOV3 cells after 1 (“1”), 6 (“2”), and 24 hours (“3”) of incubation with CS (red line) and T-CS (green line) micelles.
Abbreviations: CS, chitosan-g-stearate; FITC, fluorescein isothiocyanate; T-CS, TNYL-modified CS.
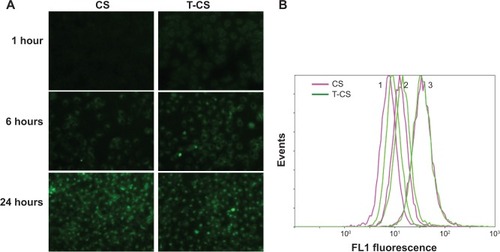
Figure 5 Cellular uptakes of CS/DOX and T-CS/DOX micelles in SKOV3 cells with different incubation times.
Note: The images in the green square show the cellular uptake of DOX-loaded micelles with a short incubation time.
Abbreviations: CS, chitosan-g-stearate; DOX, doxorubicin; T-CS, TNYL-modified CS.
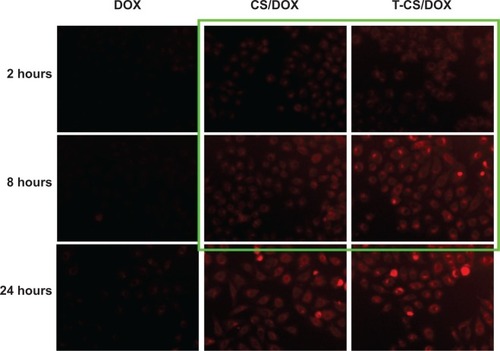
Figure 6 Confocal microscopy images of the cells after the DOX-loaded micelles were added into the SKOV3 and A549 co-incubation system for 1 hour.
Notes: A549 cells (the cytoplasmic membrane labeled with PKH67 fluorescent linker [green] indicated by the yellow arrows) co-cultured with SKOV3 cells (indicated by the white arrows) were incubated with CS/DOX and T-CS/DOX micelles (red). The cells were all stained with Hoechst 33342.
Abbreviations: CS, chitosan-g-stearate; DOX, doxorubicin; T-CS, TNYL-modified CS.
![Figure 6 Confocal microscopy images of the cells after the DOX-loaded micelles were added into the SKOV3 and A549 co-incubation system for 1 hour.Notes: A549 cells (the cytoplasmic membrane labeled with PKH67 fluorescent linker [green] indicated by the yellow arrows) co-cultured with SKOV3 cells (indicated by the white arrows) were incubated with CS/DOX and T-CS/DOX micelles (red). The cells were all stained with Hoechst 33342.Abbreviations: CS, chitosan-g-stearate; DOX, doxorubicin; T-CS, TNYL-modified CS.](/cms/asset/c0851199-4a3c-4816-8835-5677658bdbe7/dijn_a_69572_f0006_c.jpg)
Figure 7 (A) SKOV3 cell inhibition against blank micelle concentrations and (B) DOX concentration in different drug preparations after the cells were incubated with blank micelles or different drug preparations for 48 hours.
Note: DOX.HCl was chosen as the positive control.
Abbreviation: CS, chitosan-g-stearate; T-CS, TNYL-modified CS; DOX, doxorubicin.
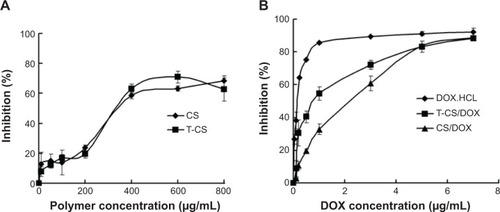
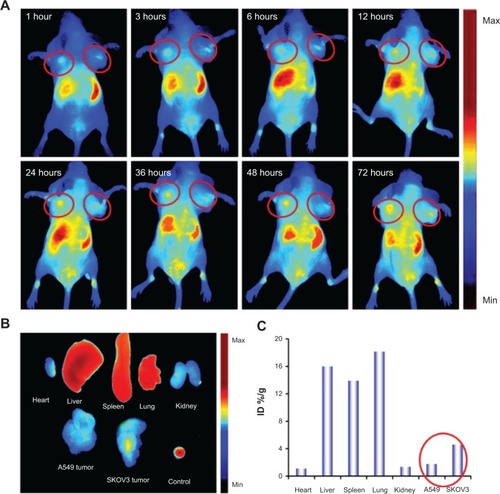
Figure 8 In vivo imaging of the mice, bearing SKOV3 and A549 tumors in the left and right flanks, respectively after (A) T-CS micelles encapsulating the DiR probe injected intravenously for different lengths of time. (B) Fluorescent image of various tissues ex vivo 72 hours post-injection. (C) The accumulation of T-CS micelles in tissues was calculated as % ID/g.
Abbreviations: DiR, 1,1′-dioctadecyl-3,3,3′,3′-tetramethylindotricarbocyanine iodide; ID, injected dose; max, maximum; min, minimum; T-CS, TNYL-modified CS.