Figures & data
Table 1 Treatment conditions for studying BBB disruption
Figure 1 Transmission electron microscopic image of methotrexate-loaded biotinylated liposomes, composed of biotin-DSPE-PEG2000, dipalmitoyl phosphatidyl-glycerol, distearoyl phosphatidylcholine, and PEG4000, showing spherical morphology.
Note: Bar 100 nm.
Abbreviations: DSPE, 1,2-distearoyl-sn-glycero-3-phosphoethanolamine; PEG, polyethylene glycol.
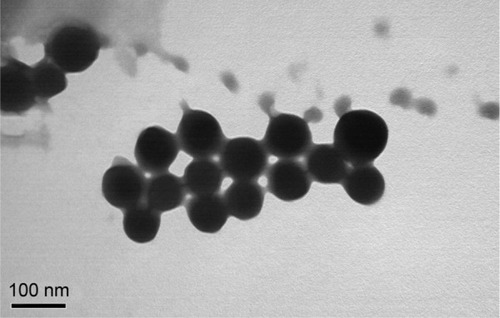
Figure 2 Size distribution of methotrexate-liposome-coupled microbubbles.
Notes: The size distribution of methotrexate-liposome-coupled microbubbles (A) was different from that of unmodified ZHIFUXIAN microbubbles (B).
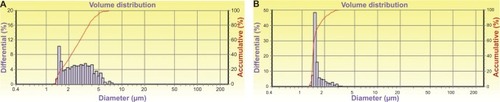
Figure 3 Inhibition of proliferation of Walker-256 cells after treatment for 24 hours with or without sonication.
Notes: Data are presented as the mean ± standard deviation (n=9). **P<0.01; ***P<0.001.
Abbreviations: MTX, methotrexate; MNL, MTX-loaded liposomes; MNL-CA, MTX-liposome-coupled microbubbles; US, ultrasound; UCA, unmodified ZHIFUXIAN.
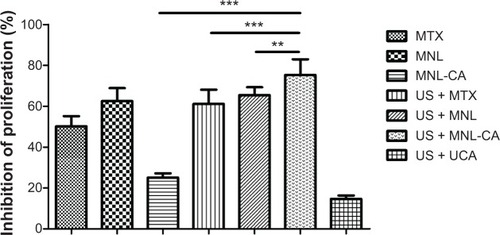
Figure 4 Induction of apoptosis in Walker-256 cells after treatment for 24 hours with or without sonication.
Notes: Data are presented as the mean ± standard deviation (n=9). ***P<0.001.
Abbreviations: Con, control; MTX, methotrexate; MNL, MTX-loaded liposomes; MNL-CA, MTX-liposome-coupled microbubbles; US, ultrasound; UCA, unmodified ZHIFUXIAN.
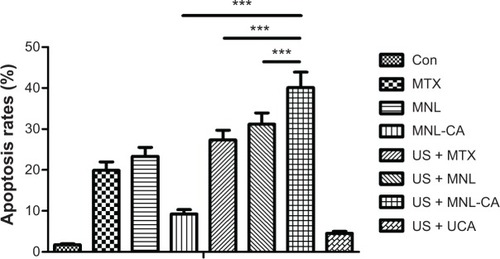
Figure 5 Microphotographs of Evans blue staining in rat brains to monitor the extent of blood–brain barrier disruption in rats following treatment with methotrexate-liposome-coupled microbubbles and ultrasound.
Notes: (A) Rats receiving Evans blue injection only. (B) Rats treated with methotrexate-methotrexate-liposome-coupled microbubbles and ultrasound under the conditions shown for group 5 in .
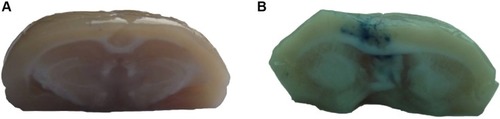
Figure 6 EB extravasation into the rat brain following the treatments shown in .
Notes: EB was extracted from the brain tissues and determined by absorbance at 620 nm. The rats in the control group received the EB injection only. Data are presented as the mean ± standard deviation (n=10). *P<0.05 versus control; ***P<0.001 versus control; NS, P>0.05 versus control.
Abbreviations: Con, control; EB, Evans blue.
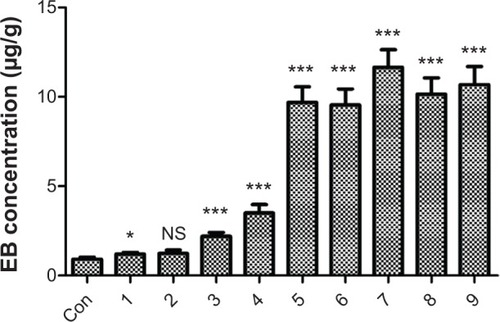
Figure 7 Concentration of MTX in the parietal lobe of the rat brain after treatment with MTX-liposome-coupled microbubbles with or without ultrasound.
Notes: Data are presented as the mean ± standard deviation (n=10). ***P<0.001.
Abbreviations: MTX, methotrexate; US, ultrasound; MNL-CA, MTX-liposome-coupled microbubbles; UCA, unmodified ZHUFIXIAN.
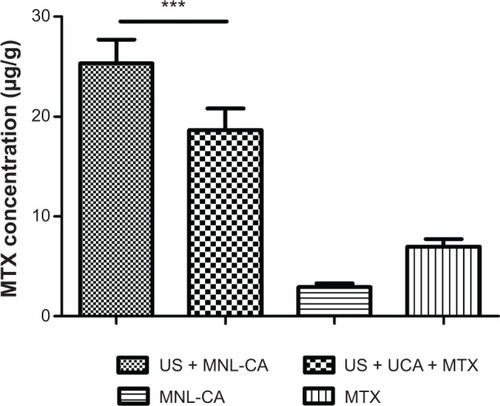
Figure 8 H&E-stained brain tissue after optimal ultrasound treatment.
Notes: Every tenth brain section was stained with H&E. No tissue or capillary damage was noted in rats treated with sonication. An example section is shown. Bar 200 μm.
Abbreviation: H&E, hematoxylin-eosin.
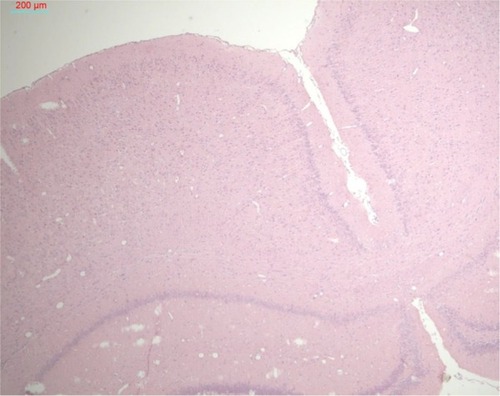
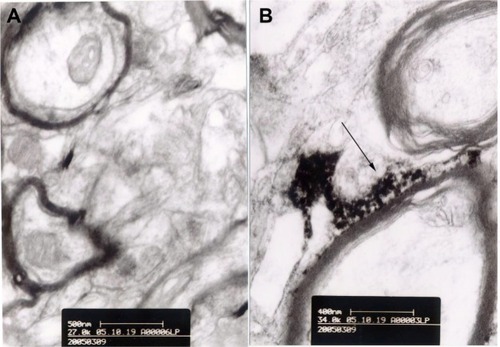
Figure 9 Transmission electron microscopic images of lanthanum nitrate-perfused rat brain.
Notes: (A) Control rats; bar 500 nm. (B) Rats treated with methotrexate-liposome-coupled microbubbles and ultrasound showing lanthanum deposition outside the basement membrane of the vascular wall. The arrow shows lanthanum deposition between the nerve fibers; bar 400 nm.