
Figures & data
Figure 1 Docetaxel-loaded solid lipid nanoparticles inhibit growth and induce apoptosis in human MCF-7 cancer cells.
Notes: MCF-7 cells were treated with 1–100 nM docetaxel-loaded solid lipid nanoparticles or Taxotere® for 24 hours (A, D, E), 48 hours (B, F, G), and 72 hours (C), respectively. Cell viability was quantified (A–C). Apoptosis was determined at 24 hours (D) and 48 hours (F). Fluorescence-activated cell sorting results of the 5 nM dose for 24 hours (E) and the 50 nM dose for 48 hours (G). The lower right quadrant and upper right quadrant represent the percentage of early apoptotic cells and late apoptotic cells, respectively. Data are presented as mean ± standard error from three experiments. *P<0.05.
Abbreviations: BSN, blank solid lipid nanoparticle; DSN, docetaxel-loaded solid lipid nanoparticle; LL, lower left; LR, lower right; TAX, Taxotere; UL, upper left; UR, upper right.
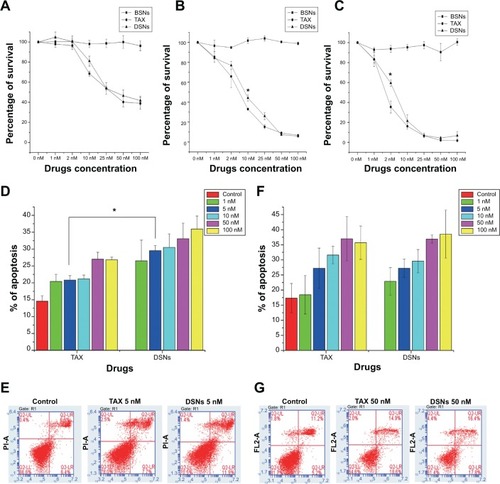
Figure 2 Docetaxel-loaded solid lipid nanoparticles induce G2/M cell cycle arrest in MCF-7 cells.
Notes: Cells were mock treated or treated with 1–100 nM docetaxel-loaded solid lipid nanoparticles, Taxotere®, or blank solid lipid nanoparticles for 24 hours (A, B) and 48 hours (C, D), respectively. Cells were fixed and stained with propidium iodide for cell cycle phase distribution analysis. Representative flow cytometry profiles of the cell cycle phase distribution of MCF-7 cells after treatment for 24 hours (A) and 48 hours (C). The first peak indicates 2n DNA content in the G0/G1 phase, the second peak indicates 4n DNA content in the G2/M phase, and in-between the two peaks is the S phase. Cell cycle phase distribution of MCF-7 cells after treatment for 24 hours (B) and 48 hours (D). Data are presented as mean ± standard error from three experiments.
Abbreviations: BSN, blank solid lipid nanoparticle; DSN, docetaxel-loaded solid lipid nanoparticle; TAX, Taxotere.
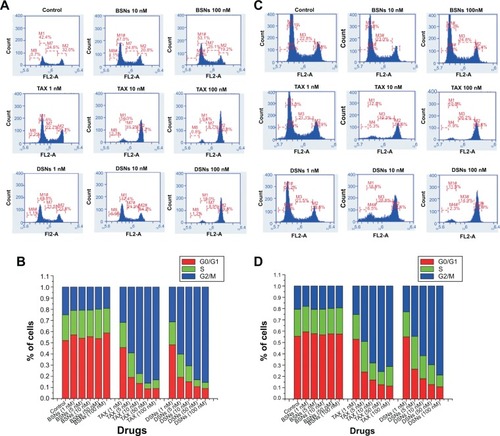
Table 1 Antitumor efficiency of docetaxel-loaded solid lipid nanoparticles and Taxotere® in vivo
Figure 3 Body weight changes of tumor-bearing mice and the antitumor effect of docetaxel-loaded solid lipid nanoparticles and Taxotere®.
Notes: Tumor-bearing mice were treated with 10 mg/kg docetaxel-loaded solid lipid nanoparticles or Taxotere. Their body weight was measured at the indicated days and the mean weight of each group is shown (A). An equal amount of blank solid lipid nanoparticles and glucose was set as the control. The tumor volume was measured at the indicated days and the mean volume of each group is shown (B).
Abbreviations: BSN, blank solid lipid nanoparticle; DSN, docetaxel-loaded solid lipid nanoparticle; GLU, glucose; TAX, Taxotere.
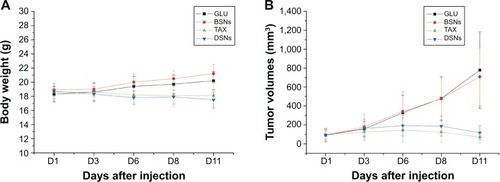
Figure 4 The union of differentially expressed genes in MCF7 cells when treated with glucose, Taxotere®, and docetaxel-loaded solid lipid nanoparticles.
Notes: Differentially expressed genes (adjusted P<0.05; fold change >1.5) were clustered into two groups, following functional annotation and enrichment analysis in each group. Each row represents one Entrez Gene, and the color scheme shows a normalized log2 gene expression index (A). The Venn diagram shows the common and differentially expressed genes under Taxotere and docetaxel-loaded solid lipid nanoparticles when compared with glucose (B).
Abbreviations: BSN, blank solid lipid nanoparticle; down, downregulated; DSN, docetaxel-loaded solid lipid nanoparticle; GLU, glucose; TAX, Taxotere; up, upregulated.
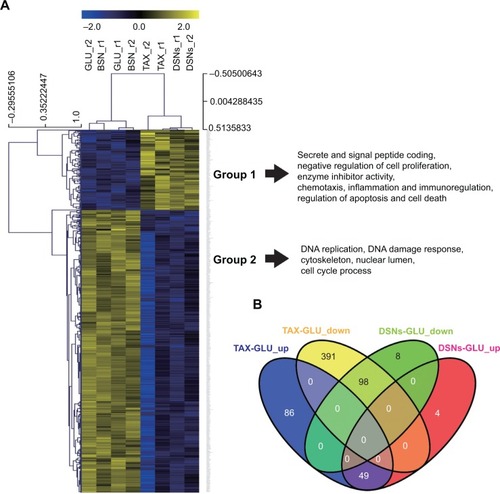
Table 2 Downregulated (↓) and upregulated (↑) genes in the Taxotere®- and docetaxel-loaded solid lipid nanoparticle-treated groups
Figure 5 Genes regulated by Taxotere® and docetaxel-loaded solid lipid nanoparticles were confirmed by quantitative polymerase chain reaction and immunoblotting.
Notes: Cell cycle-related genes of E2F8 (A) and OIP5 (B), proliferation-related genes of NASP (C) and SOD2 (D), and apoptosis-related genes of PDCD4 (E) and PIK3R2 (F) were chosen for detection by quantitative polymerase chain reaction and immunoblotting. In quantitative polymerase chain reaction detection, mock-treated cells were set as the control and samples were normalized with the control. In immunoblotting detection, β-actin was used as the loading control.
Abbreviations: BSN, blank solid lipid nanoparticle; DSN, docetaxel-loaded solid lipid nanoparticle; GLU, glucose; qPCR, quantitative polymerase chain reaction; TAX, Taxotere.
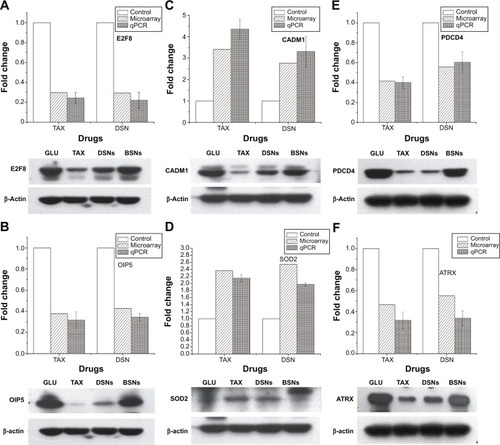
Figure 6 The hematopoietic recovery effect of docetaxel-loaded solid lipid nanoparticles.
Notes: Bone marrow cells from mice were incubated with blank solid lipid nanoparticles, docetaxel-loaded solid lipid nanoparticles, or Taxotere® at 3 nM or 6 nM for 9 days in methylcellulose-based media. Mock-treated cells were used as the control. Optical photos show the microscopic colonies that formed in a 24-well plate (A). Colonies of colony forming units that generate granulocytes and macrophages (B), burst-forming units that generate erythroids (C), and colony forming units that generate granulocytes, erythroids, macrophages, and megakaryocytes (D) were counted using an inverted microscope. The data are presented as mean ± standard error from three experiments. *P<0.05. **P<0.01.
Abbreviations: BFU-E, burst-forming units that generate erythroids; BSN, blank solid lipid nanoparticle; Ctrl, control; CFU-GEMM, colony forming units that generate granulocytes, erythroids, macrophages, and megakaryocytes; CFU-GM, colony forming units that generate granulocytes and macrophages; DSN, docetaxel-loaded solid lipid nanoparticle; TAX, Taxotere.
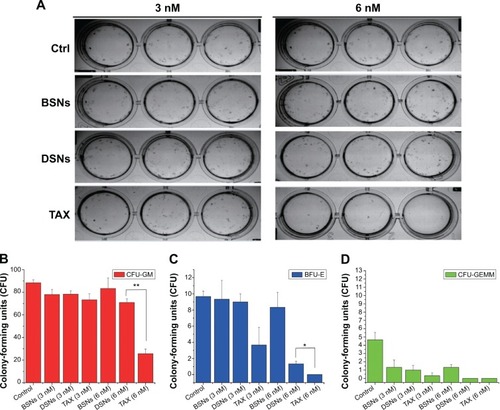
Figure S1 The morphology of docetaxel-loaded solid lipid nanoparticles observed by transmission electron microscopy.
Note: Scale bar = 200 nm.
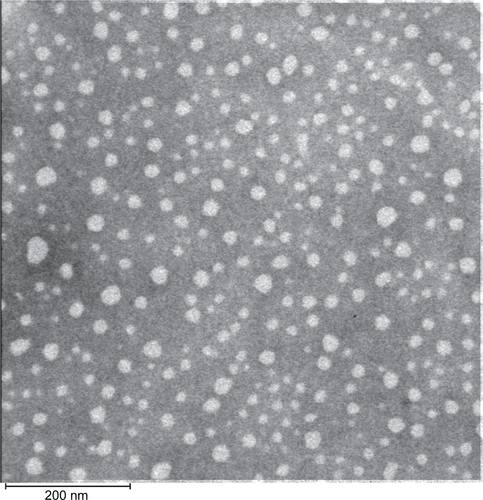
Figure S2 Cell morphology was evaluated under light microscopy after docetaxel-loaded solid lipid nanoparticle and Taxotere® treatment.
Notes: MCF-7 cells were treated with 0–100 nM of docetaxel-loaded solid lipid nanoparticles or Taxotere for 48 hours, then cell morphology was observed under light microscopy and photos were taken under a 10× lens. Blank solid lipid nanoparticles were used as the control.
Abbreviations: BSN, blank solid lipid nanoparticle; DSN, docetaxel-loaded solid lipid nanoparticle; TAX, Taxotere.
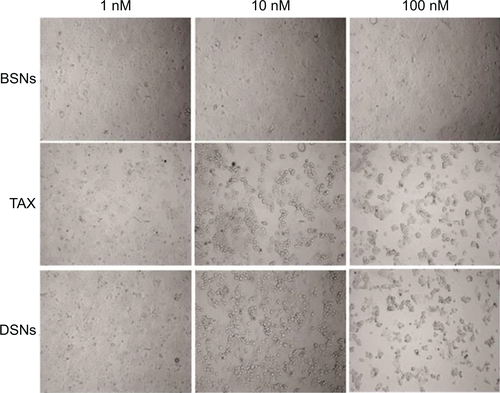
Figure S3 Fold change in transcription after drug treatment of genes involved in cell proliferation, apoptosis, cell cycle regulation, and DNA damage response detected by messenger RNA microarray and quantitative polymerase chain reaction.
Note: The mock-treated sample was set as the control and other samples were normalized with the control.
Abbreviations: DSN, docetaxel-loaded solid lipid nanoparticle; qPCR, quantitative polymerase chain reaction; TAX, Taxotere®.
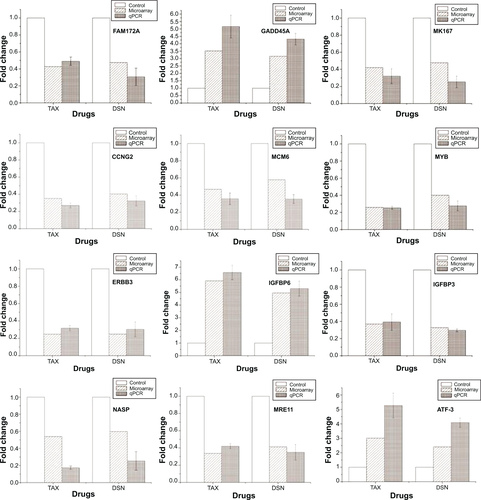
Figure S4 Change in the protein expression of genes involved in cell proliferation, apoptosis, cell cycle regulation, and DNA damage response after drug treatment detected by immunoblotting.
Note: β-actin was used as the loading control.
Abbreviations: BSN, blank solid lipid nanoparticle; DSN, docetaxel-loaded solid lipid nanoparticle; GLU, glucose; TAX, Taxotere®.
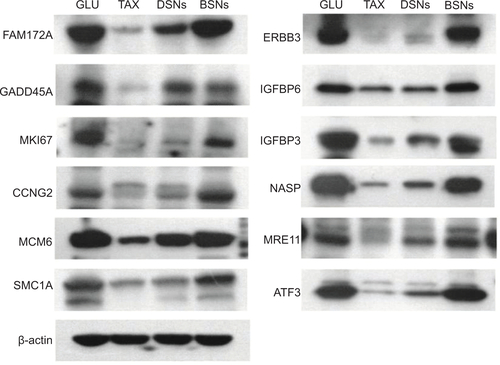
Table S3 Primers used for quantitative polymerase chain reaction