Figures & data
Figure 1 Characterization of Nano-SiO2.
Notes: The TEM images of Nano-SiO2 exhibit a near-spherical shape with relatively favorable dispersibility. The average diameter of Nano-SiO2 is approximately 62 nm.
Abbreviations: Nano-SiO2, silica nanoparticles; TEM, transmission electron microscopy.
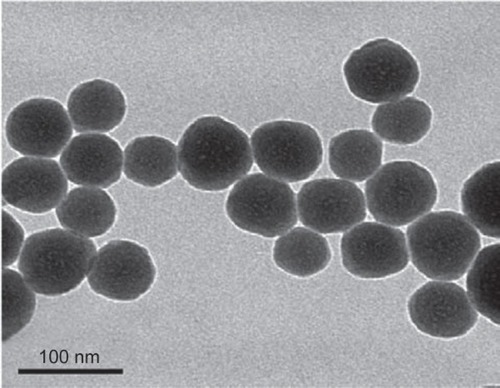
Figure 2 Subcellular localization of Nano-SiO2.
Notes: LSCM images of HUVECs after incubation for 24 hours with red fluorescent-labeled Nano-SiO2 (50 μg/mL and 100 μg/mL). The cell skeleton is stained with Phalloidin-FITC (green), and the cell nucleus with DAPI (blue).
Abbreviations: Nano-SiO2, silica nanoparticles; LSCM, laser scanning confocal microscope; HUVEC, human umbilical vein endothelial cells; FITC, fluorescein isothiocyanate; DAPI, 4,6-diamidino-2-phenylindole.
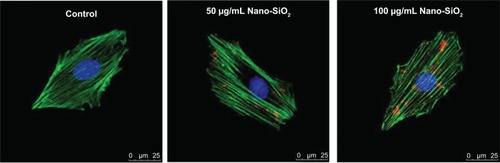
Figure 3 Autophagy activation in HUVECs treated with Nano-SiO2 measured by ultrastructural analysis.
Notes: (A and B) Untreated cells with normally shaped organelles; (C and D) HUVECs treated with Nano-SiO2 showing multiple cytoplasmic vacuoles. Some vacuoles contained electron-dense Nano-SiO2 and cellular debris (white arrows). Detailed analysis of HUVECs exposed to Nano-SiO2 revealed the clear presence of: (E) double-membranous phagophores developing into autophagosomes (white arrows) concomitant with swollen or cristae-rupturing mitochondria (black arrows); (F) autophagosomes (white arrows); (G) autolysosomes/amphisomes containing cytoplasmic materials (white arrows); and (H) autolysosomes/amphisomes containing mitochondria and electron-dense Nano-SiO2 undergoing degradation at different stages (white arrows).
Abbreviations: HUVECs, human umbilical vein endothelial cells; Nano-SiO2, silica nanoparticles.
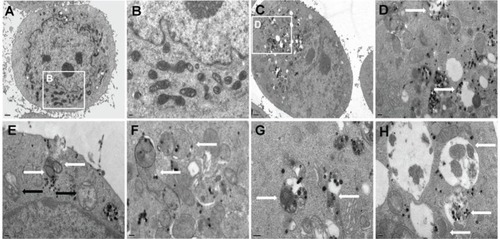
Figure 4 Detection of autophagic vacuoles induced by Nano-SiO2 via MDC staining.
Notes: (A) Confocal microscopy images of MDC staining after HUVECs were exposed to 50 μg/mL of Nano-SiO2 for 24 hours. (B) Quantification of MDC staining by fluorescent intensity analysis. Student’s t-test is used for the data analysis. Data are expressed as the mean ± standard deviation from three independent experiments (*P<0.05).
Abbreviations: Nano-SiO2, silica nanoparticles; MDC, monodansylcadaverine; HUVECs, human umbilical vein endothelial cells.
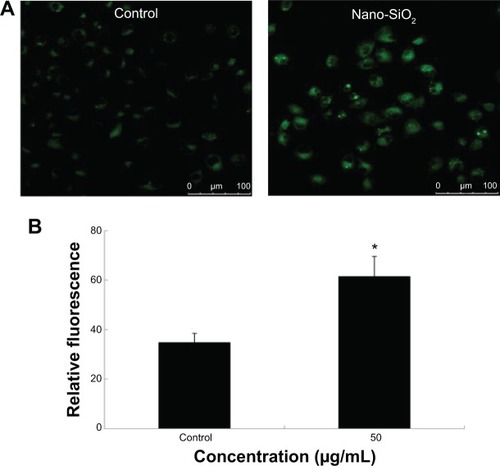
Figure 5 LC3-I/LC3-II conversion in HUVECs treated with Nano-SiO2.
Notes: (A) The autophagy marker LC3 protein is detected by Western blot analysis. (B) Relative densitometric analysis showed that the ratio of LC3-II/LC3-I significantly elevated in a dose-dependent manner. ANOVA followed by the LSD method are used for the data analysis. Data are expressed as the mean ± standard deviation from three independent experiments (*P<0.05).
Abbreviations: LC3, microtubule-associated protein 1 light chain 3β; GAPDH, glyceraldehyde 3-phosphate dehydrogenase; HUVECs, human umbilical vein endothelial cells; Nano-SiO2, silica nanoparticles; ANOVA, one-way analysis of variance; LSD, least significant difference.
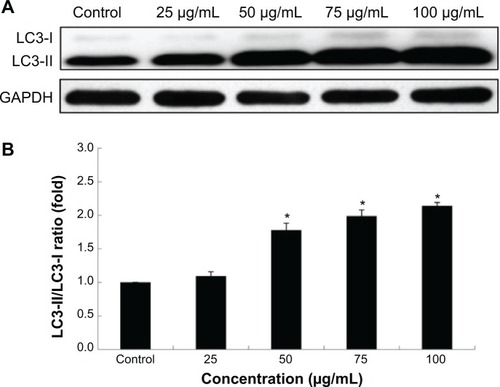
Figure 6 Effects of Nano-SiO2 on the NO/NOS system in HUVECs.
Notes: The release of NO (A) and the activity of NOS (B) and eNOS (C) were significantly decreased, while the level of iNOS (D) increased markedly in a dose-dependent manner. ANOVA followed by the LSD method are used for the data analysis. Data are expressed as the mean ± standard deviation from three independent experiments (*P<0.05).
Abbreviations: NO, nitric oxide; NOS, nitric oxide synthase; eNOS, endothelial nitric oxide synthase; iNOS, inducible nitric oxide synthase; Nano-SiO2, silica nanoparticles; HUVECs, human umbilical vein endothelial cells; ANOVA, one-way analysis of variance; LSD, least significant difference.
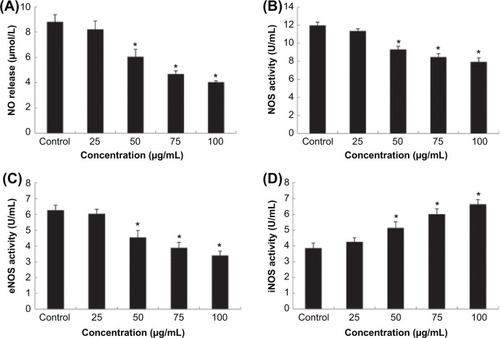
Figure 7 Effects of Nano-SiO2 on the production of CRP and cytokines in HUVECs.
Notes: The expression of CRP (A) and the production of TNF-α (B), IL-1β (C), and IL-6 (D) were significantly increased in a dose-dependent manner. ANOVA followed by the LSD method are used for the data analysis. Data are expressed as the mean ± standard deviation from three independent experiments (*P<0.05).
Abbreviations: CRP, C-reactive protein; TNF, tumor necrosis factor; IL, interleukin; Nano-SiO2, silica nanoparticles; HUVECs, human umbilical vein endothelial cells; ANOVA, one-way analysis of variance; LSD, least significant difference.
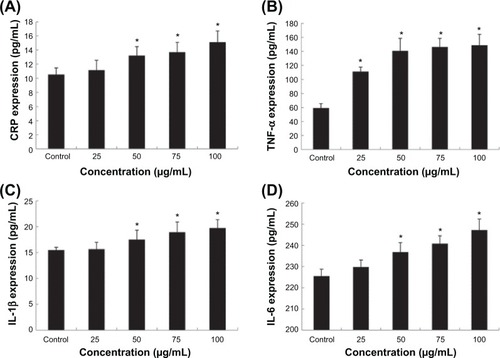
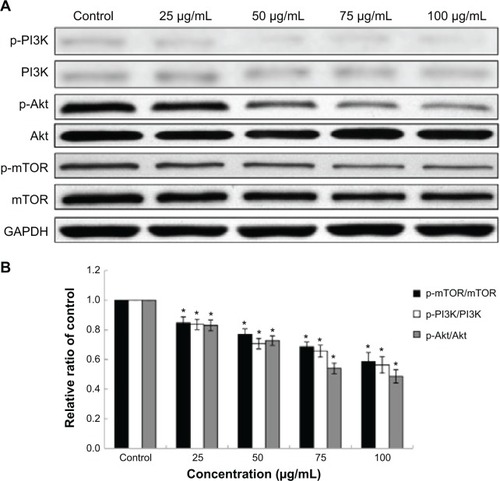
Figure 8 Effects of Nano-SiO2 on the PI3K/Akt/mTOR signaling pathway.
Notes: (A) The expression of p-PI3K, PI3K, p-Akt, Akt, p-mTOR, and mTOR were measured by Western blot assay. (B) Relative densitometric analysis of the protein bands was performed and presented. Nano-SiO2 inhibited the PI3K/Akt/mTOR signaling pathway. ANOVA followed by the LSD method are used for the data analysis. Data are expressed as the mean ± standard deviation from three independent experiments (*P<0.05).
Abbreviations: PI3K, phosphoinositide 3-kinase; Akt, protein kinase B; mTOR, mammalian target of rapamycin; GAPDH, glyceraldehyde 3-phosphate dehydrogenase; Nano-SiO2, silica nanoparticles; ANOVA, one-way analysis of variance; LSD, least significant difference.