Figures & data
Figure 1 Characterization of AgNPs by TEM (A) and spectroscopy (B).
Abbreviations: AgNPs, silver nanoparticles; TEM, transmission electron microscopy.
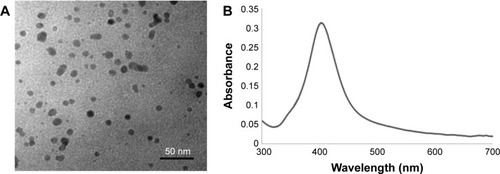
Figure 2 Effect of AgNPs and GEPO on cell viability.
Notes: Effect of AgNPs on the viability of HEK293 cells at 4 hours of exposure (A). Percentage of viable cells following AgNPs exposure with or without GEPO pretreatment (B). Data are the average of four replicate samples (***P<0.001 and ****P<0.0001 compared with the AgNP-treated group). + indicates 0.0084 µg/mL GEPO added; ++ indicates 0.042 µg/mL GEPO added; +++ indicates 0.084 µg/mL GEPO added; and − indicates no GEPO added.
Abbreviations: AgNPs, silver nanoparticles; GEPO, glutaraldehyde erythropoietin.
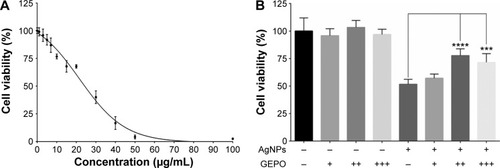
Figure 3 Effect of AgNPs and GEPO on cell morphology.
Notes: Light microscopy and TEM images of untreated cells showed no morphological changes (A and D). After 4 hours of exposure to AgNPs, morphological structures indicating cellular damage and apoptosis were detected (B and E). Pretreatment with GEPO maintained a near normal cell shape (C and F). (A–C) 200× magnification used.
Abbreviations: AgNPs, silver nanoparticles; GEPO, glutaraldehyde erythropoietin; TEM, transmission electron microscopy; LM, light microscopy.
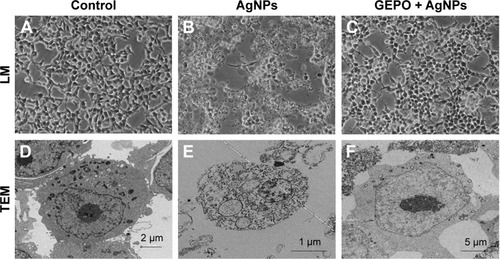
Figure 4 Death pattern analysis of cells treated with DMEM only (A), AgNPs (B), or pretreated with GEPO before administration of AgNPs (C).
Abbreviations: DMEM, Dulbecco’s Modified Eagle’s Medium; AgNPs, silver nanoparticles; GEPO, glutaraldehyde erythropoietin; PI, propidium iodide.
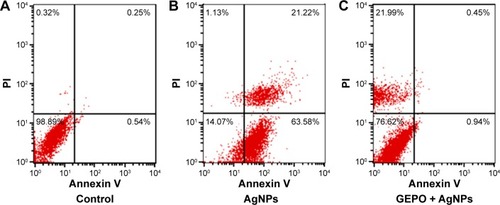
Figure 5 Detection of Ki-67 mRNA expression in HEK293 cells exposed to AgNPs with and without GEPO or EPO pretreatment.
Note: Data are the average of three replicate samples (**P<0.001 and ***P<0.0001 compared with the AgNP-treated group). “−” indicates no GEPO added; “+” indicates 0.042 µg/mL GEPO added.
Abbreviations: AgNPs, silver nanoparticles; GEPO, glutaraldehyde erythropoietin; EPO, erythropoietin.
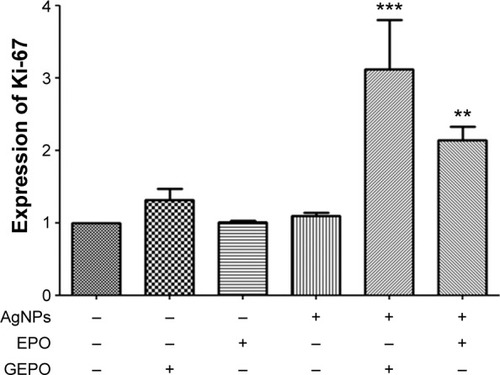
Figure 6 ROS generation of HEK293 cells in the presence of AgNPs with and without GEPO or EPO pretreatment.
Note: Data are the average of four replicate samples (****P<0.0001 compared with the AgNP-treated group).
Abbreviations: ROS, reactive oxygen species; AgNPs, silver nanoparticles; GEPO, glutaraldehyde erythropoietin; EPO, erythropoietin; ASC, ascorbic acid.
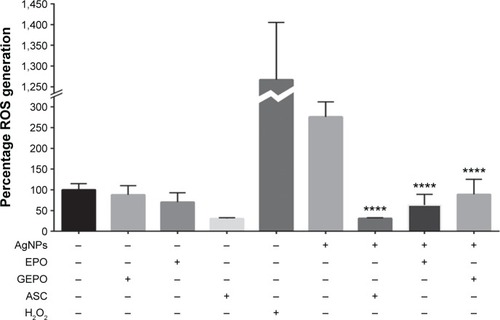
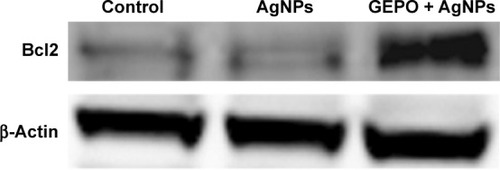
Figure 7 Western blot analysis of Bcl2 protein in AgNP-treated cells with or without GEPO pretreatment.
Abbreviations: AgNP, silver nanoparticle; GEPO, glutaraldehyde erythropoietin.