
Figures & data
Table 1 Clinical Characteristics of the Study Population Overall and by CKD Status
Table 2 Correlations Between Blood Pressure and Measures of Body Fat Distribution
Figure 1 Adjusted association between blood pressure indices and anthropometric-derived measures of body fat distribution, dichotomized by CKD status. Presentation of graphs are as follows: Adjusted association between, (A) systolic blood pressure and body mass index, (B) pulse pressure and body mass index, (C) systolic blood pressure and waist circumference and (D) pulse pressure and waist circumference. Data is presented as (1) linear predictive margins for those with CKD (dashed line) and those without CKD (solid line) with 95% CI and (2) the average marginal effect (dy/dx), 95% CI and p-value indicating the association between blood pressure and measures of body fat distribution, for those with and without CKD.
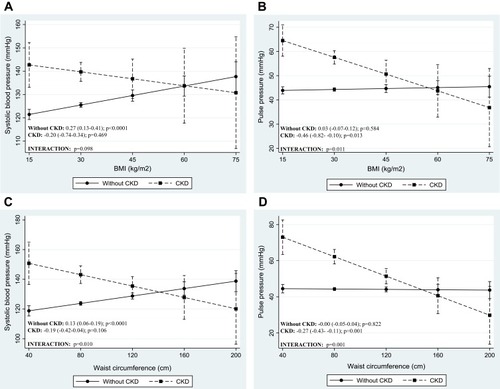
Figure 2 Adjusted association between blood pressure indices and DXA-derived measures of body fat distribution, dichotomized by CKD status. Presentation of graphs are as follows: Adjusted association between, (A) systolic blood pressure and leg fat mass, (B) pulse pressure and leg fat mass. Data is presented as (1) linear predictive margins for those with CKD (dashed line) and those without CKD (solid line) with 95% CI and (2) the average marginal effect (dy/dx), 95% CI and p-value indicating the association between blood pressure and measures of body fat distribution, for those with and without CKD.
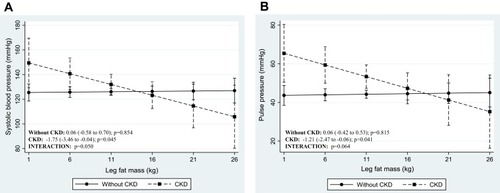
Table 3 Regression Coefficients from Robust Multiple Linear Models for the Prediction of Blood Pressure Level by Anthropometric-Derived Measures of Body Fat Distribution, Accounting for Potential Effects of Age and Gender
Table 4 Regression Coefficients from Robust Multiple Linear Models for the Prediction of Blood Pressure by DXA-Derived Measures of Body Fat Distribution, Accounting for Potential Effects of Age and Gender