
Figures & data
Figure 1 Comparison of total testosterone (left) and free testosterone (right) concentrations according to CKD stage.
Abbreviation: GFR, glomerular filtration rate (mL/min/1.73 m2).
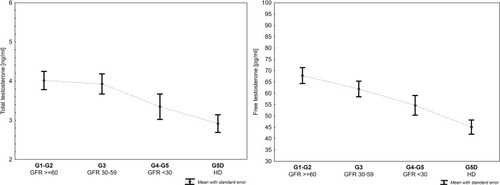
Figure 2 Initial (A) and optimal (B) risk categories of hypogonadism based on CKD stage in the study group (men ≥40 years).
Abbreviations: IV, information value; WOE, weight of evidence (WoE technique).
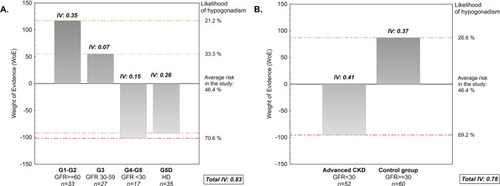
Table 1 Characteristics of the Advanced CKD and the Control Group
Table 2 Univariate Logistic Regression Models Evaluating Independent Markers of Hypogonadism in the Study Population