
Figures & data
Table 1 PCOS Phenotypes According to Diagnostic Criteria Applied.Citation5–8
Figure 1 General characteristics and classification proportion of PCOS population.
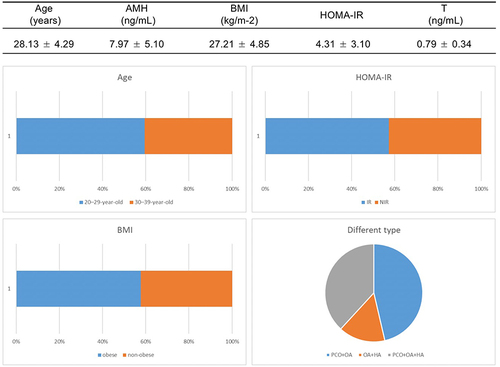
Table 2 PCOS General Information and Comparison of PCOS General Information Among Different Age Groups
Table 3 Comparison of AMH Levels and Other Indicators Under Different HOMA-IR Conditions
Table 4 Comparison of AMH Level and Other Indexes Under Different BMI
Table 5 Comparison of AMH Level and Other Indexes in Different PCOS Phenotypes
Figure 2 Indicators of significant differences in different PCOS phenotypes. *P <0.05, #P <0.01 vs. PCO+OA.
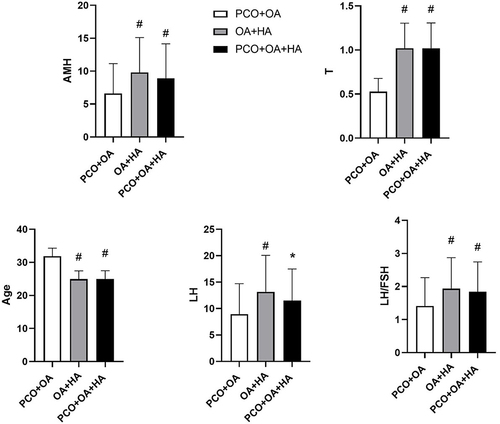
Table 6 Correlation Analysis of AMH and Various Indexes
Table 7 Multiple Linear Regression Analysis of AMH Influencing Factors
Table 8 Correlation Analysis of AMH and Various Indexes in Different PCOS Phenotypes
Table 9 Multiple Linear Regression Analysis of AMH Influencing Factors in Different PCOS Phenotypes