
Figures & data
Table 1 Clinical and Pathological Characteristics of 383 Non-Cancer Patients and 358 Cancer Patients
Figure 1 A patient flow diagram in accordance with the international Standards for Reporting of Diagnostic Accuracy Studies (STARD) guidelines.
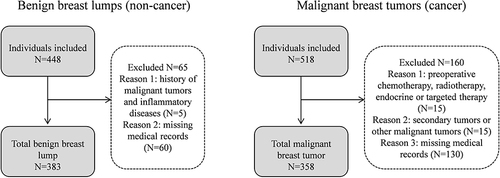
Table 2 The Correlation of Overweight on the Proportion of Non-Cancer or Cancer Cases
Table 3 Correlation Between BMI and the Proportion of Non-Cancer or Cancer Cases
Table 4 Multivariate Logistic Regression Analysis of Putative-Risk Factors for Breast Cancer
Table 5 Correlation Between BMI and Peripheral Blood Inflammatory Indicators
Table 6 Comparison of Inflammatory Indicators in the Peripheral Blood of Non-Cancer and Cancer Patients
Table 7 Overweight and High Levels of Some Inflammatory Indicators are Putative-Risk Factors for Breast Cancer
Figure 2 ROC curve of BMI (a) and WBC (b), NE (c), hsCRP (d), and NLR (e) in peripheral blood.
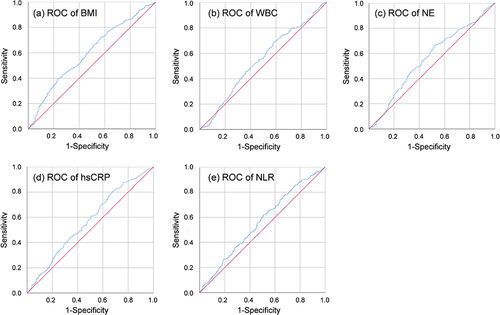
Table 8 Multivariate Logistic Regression Analysis of Inflammatory Indicators for Breast Cancer
Table 9 Comparison of Inflammatory Indicators with the Size of Malignant Breast Tumors