
Figures & data
Table 1 Characteristics of Patients with Different Serum P Levels (1.5 ng/mL) on the hCG Day
Figure 1 A smooth fitting curve analysis of the relationship between serum P levels on the hCG day and the CPR. The CPR kept stable as the P level increased. The area between two dotted lines is expressed as the 95% CI.
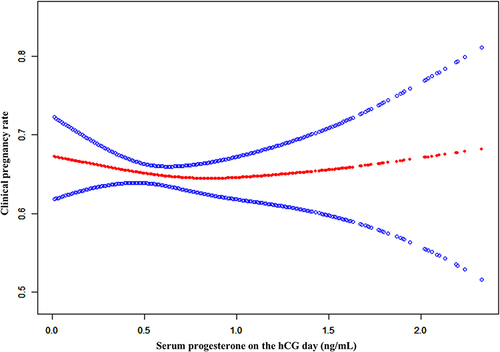
Table 2 Effect Modification of P Levels on the hCG Day on CPR According to Different Types of Embryos Transferred
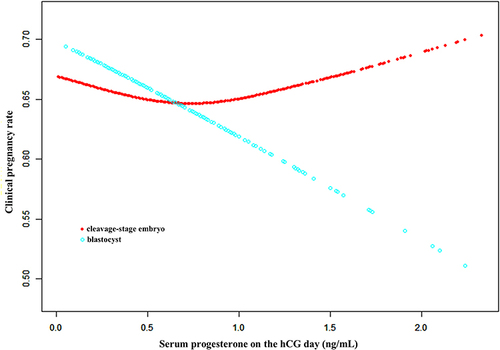
Figure 2 A smooth fitting curve analysis of the relationship between serum P levels on the hCG day and the CPR of different types of embryos transferred. The CPR of blastocyst transfer decreased as the P level on the hCG day gradually increased. The area between two dotted lines is expressed as the 95% CI.
Data Sharing Statement
The datasets generated and analysed during the current study are not publicly available due to the special requirements of our hospital and our reproductive medicine center for the disclosure of patients’ clinical data but are available from the corresponding author on reasonable request.