Figures & data
Table 1 Primers and Probes for Genotyping by TaqMan Assay
Table 2 Distribution of Selected Variables Among Cases and Controls
Table 3 Primary Information of Six SNPs in the GARP Gene
Table 4 Genotypes and Allele Frequencies in GARP Polymorphisms Among Cases and Controls
Table 5 Stratification Analysis of rs79525962 in the Dominant Model in PER Subgroups
Table 6 Genotype Frequencies of GARP Polymorphisms in the Dominant Model in PER Patients with and without Asthma
Table 7 Associations Between GARP Polymorphisms and AR-Related Phenotypes
Table 8 Associations Between PER Risk and the Frequencies of Haplotypes
Figure 1 Linkage disequilibrium (LD) of six SNPs in the GARP gene. LD of six SNPs was determined using the solid spine of LD option of Haploview 4.2. D’ values are displayed in the squares. Empty red squares have a pairwise D’ of 1.0. Red squares indicate strong pairwise LD, gradually coloring down to white squares of weak pairwise LD.
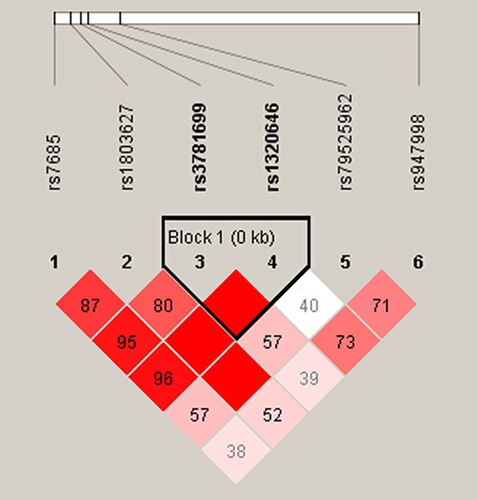
Table 9 Functional Annotation of 3 SNPs in silico Analysis
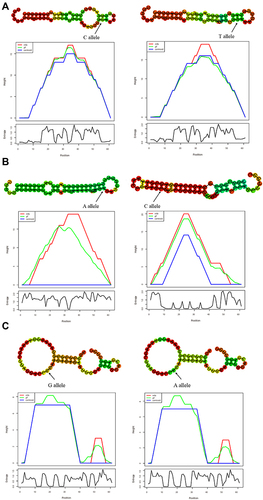
Figure 2 In silico prediction of secondary structures and minimum free energy (MFE) changes corresponding to GARP SNPs. (A) The MFE changed from −21 kcal/mol to −19.1 kcal/mol caused by rs79525962 (C > T), indicating a stronger binding affinity of microRNAs to the C allele. (B) The MFE changed from −16.4 kcal/mol to −21.6 kcal/mol caused by rs3781699 (A > C), indicating a stronger binding affinity of microRNAs to the C allele. (C) No change was found in MFE caused by rs1320646.